import cv2 as cv
import cv2
import numpy as np
import time
from matplotlib import pyplot as plt

value = 60
value1 = 0
canny_min = 100
canny_max = 150
minlineLength = 200
maxlineGap = 10
area_threshold = 90


#用于去除杂点
def removeLittlePoint(img,threshold):
    image, contours, hierarch = cv2.findContours(img, cv2.RETR_EXTERNAL, cv2.CHAIN_APPROX_NONE)
    for i in range(len(contours)):
        area = cv2.contourArea(contours[i])
        if area < threshold:
            cv2.drawContours(image, [contours[i]], 0, 0, cv2.FILLED)
    return image


def callback(object):
    global value,value1,src2,src2_copy,src,minlineLength,maxlineGap,canny_max,canny_min,area_threshold
    src2[:,:] = src2_copy[:,:]
    #得到滑动条对应的值
    value = cv2.getTrackbarPos('value', 'adapative')
    value1 = cv2.getTrackbarPos('value1', 'adapative')
    canny_min = cv2.getTrackbarPos('canny_min', 'adapative')
    canny_max = cv2.getTrackbarPos('canny_max', 'adapative')
    minlineLength = cv2.getTrackbarPos('minlineLength', 'adapative')
    maxlineGap = cv2.getTrackbarPos('maxlineGap', 'adapative')
    area_threshold = cv2.getTrackbarPos('area_threshold', 'adapative')
    src = cv2.bilateralFilter(src2, 11, value, value1)

    cv2.imshow("src", src)
    src = cv2.cvtColor(src, cv2.COLOR_BGR2GRAY)
    roi = cv2.adaptiveThreshold(src, 255, cv2.ADAPTIVE_THRESH_GAUSSIAN_C, \
                                cv2.THRESH_BINARY, 11, 3)
    mask = np.ones((3, 1), np.uint8)
    roi = cv2.morphologyEx(roi, cv2.MORPH_OPEN, mask, iterations=2)
    roi = cv2.bitwise_not(roi)

    roi = cv2.medianBlur(roi, 3,)
    cv2.imshow('roi', roi)
    roi_all = cv2.resize(roi, (round(roi.shape[1]/6), round(roi.shape[0]/6)))
    cv2.imshow('roi_all', roi_all)

    roi_canny = cv2.Canny(roi, canny_min, canny_max)
    roi_canny = cv2.resize(roi_canny, (round(roi_canny.shape[1] ), round(roi_canny.shape[0] )))
    cv2.imshow('roi_gray', roi_canny)

    oshow = roi_canny.copy()
    oshow = cv2.cvtColor(roi_canny, cv2.COLOR_GRAY2BGR)
    draw = np.zeros((roi_canny.shape[0],roi_canny.shape[1]), dtype=np.uint8)
    #霍夫直线检测,并绘出
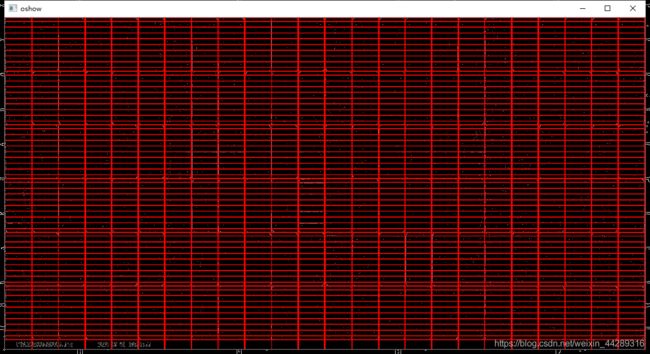
    lines = cv2.HoughLines(roi_canny, 1, np.pi / 180, 1000)
    print(len(lines))
    for line in lines:
        rho, theta = line[0]
        a = np.cos(theta)
        b = np.sin(theta)
        x0 = a * rho
        y0 = b * rho
        x1 = int(x0 + 10000 * (-b))
        y1 = int(y0 + 10000 * (a))
        x2 = int(x0 - 10000 * (-b))
        y2 = int(y0 - 10000 * (a))
        cv2.line(oshow, (x1, y1), (x2, y2), (0, 0, 255), 6,cv2.LINE_AA)
        cv2.line(draw, (x1, y1), (x2, y2), 255, 6, cv2.LINE_AA)
    oshow1 = cv2.resize(oshow, (round(oshow.shape[1] / 6), round(oshow.shape[0] / 6)))
    cv2.imshow('oshow', oshow1)

    kernel = np.ones((3, 3), np.uint8)
    dilation = cv2.dilate(oshow, kernel, iterations=6)
    draw = cv2.dilate(draw, kernel, iterations=6)
    dilation_all = cv2.resize(dilation, (round(dilation.shape[1] / 6), round(dilation.shape[0] / 6)))
    cv2.imshow('dilation_all', dilation_all)
    cv2.imshow('dilation', dilation)
    cv2.imshow('draw', draw)
    output = cv2.bitwise_and(draw, roi)
    result = roi[:, :] - output[:, :]
    output1 = cv2.resize(output, (round(output.shape[1]/6), round(output.shape[0]/6)))
    cv2.imshow('output', output1)
    result1 = cv2.resize(result, (round(result.shape[1]/6), round(result.shape[0]/6)))
    cv2.imshow('result', result1)

    new_result = removeLittlePoint(result, area_threshold)
    new_result1 = cv2.resize(new_result, (round(new_result.shape[1] / 6), round(new_result.shape[0] / 6)))
    cv2.imshow('new_result1', new_result1)

#这个没用的
# lines = cv2.HoughLinesP(roi, 1, np.pi/180, 1,  minLineLength=minlineLength, maxLineGap=maxlineGap)
    # print(len(lines))
    #
    # for line in lines:
    #     x1,y1,x2,y2 = line[0]
    #     cv2.line(oshow,(x1,y1),(x2,y2),(255,0,0),5)
    # cv2.imshow('oshow', oshow)

    #Sobely = cv2.Sobel(roi, cv2.CV_64F, 0, 1)
    #Sobely = cv2.convertScaleAbs(Sobely)
    #cv2.imshow('sobely',Sobely)

dianpianwrong = cv.imread("E:/python_opencv_demo/dianPianTest/ELtestpicture/ELtestPicture/ok/P402202008310005.jpg")


src2 = dianpianwrong.copy()
dianpianwrong = cv2.resize(dianpianwrong, (round(dianpianwrong.shape[1]/6 ), round(dianpianwrong.shape[0]/6 )))
print("src.shape", src2.shape)
cv2.imshow("origon-picture", dianpianwrong)


src2_copy = np.zeros((src2.shape[0], src2.shape[1],3), np.uint8)
src2_copy[:, :] = src2[:, :]
cv2.namedWindow("adapative", cv2.WINDOW_AUTOSIZE)
#用于创建滑动条便于调试
cv2.createTrackbar('value', 'adapative', value, 255, callback)
cv2.createTrackbar('value1', 'adapative', value1, 255, callback)
cv2.createTrackbar('canny_min', 'adapative', canny_min, 255, callback)
cv2.createTrackbar('canny_max', 'adapative', canny_max, 255, callback)
cv2.createTrackbar('minlineLength', 'adapative', minlineLength, 255, callback)
cv2.createTrackbar('maxlineGap', 'adapative', maxlineGap, 255, callback)
cv2.createTrackbar('area_threshold', 'adapative', area_threshold, 255, callback)

cv2.waitKey(0)

