Pytorch 深度学习实践Lecture_2 Linear Model
up主 刘二大人
视频链接 刘二大人的个人空间_哔哩哔哩_Bilibili
给的示例为模型y = wx
import numpy as np
import matplotlib.pyplot as plt

x_data = [1.0, 2.0, 3.0]
y_data = [2.0, 4.0, 6.0]


def forward(x):
    return x * w


def loss(x, y):
    y_pred = forward(x)
    return (y_pred - y) ** 2


# 穷举法
w_list = []
mse_list = []
for w in np.arange(0.0, 4.1, 0.1):
    print("w=", w)
    l_sum = 0
    for x_val, y_val in zip(x_data, y_data):
        y_pred_val = forward(x_val)
        loss_val = loss(x_val, y_val)
        l_sum += loss_val
        print('\t', x_val, y_val, y_pred_val, loss_val)
    print('MSE=', l_sum / 3)
    w_list.append(w)
    mse_list.append(l_sum / 3)

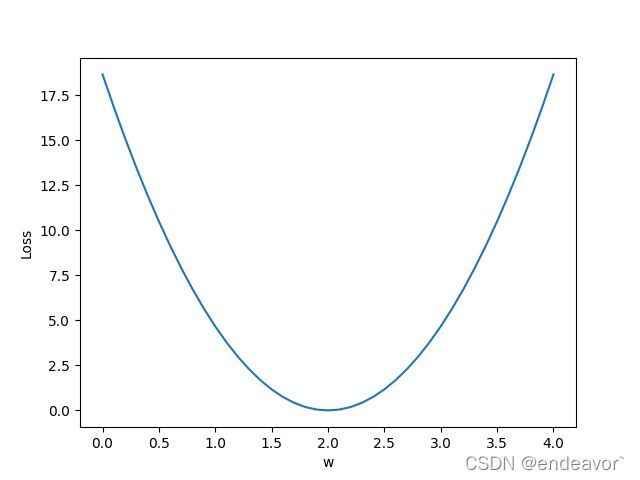
plt.plot(w_list, mse_list)
plt.ylabel('Loss')
plt.xlabel('w')
plt.show()
结果显示
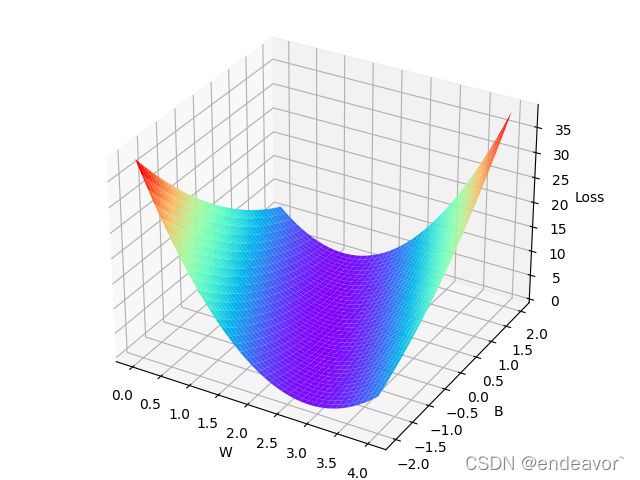
作业一要求: 线性模型改为y = wx +b 并且绘制三维图像
绘制方法1:
import numpy as np
import matplotlib.pyplot as plt
from mpl_toolkits.mplot3d import Axes3D


x_data = [1.0, 2.0, 3.0]
y_data = [2.0, 4.0, 6.0]

def forward(x):
    return x * w + b


def loss(x, y):
    y_pred = forward(x)
    return (y_pred - y) ** 2

# 穷举法
mse_list = []
W = np.arange(0.0, 4.1, 0.1)
B = np.arange(-2.0, 2.1, 0.1)
[w, b] = np.meshgrid(W, B)


l_sum = 0   # loss求和
for x_val, y_val in zip(x_data, y_data):
    loss_val = loss(x_val, y_val)
    l_sum += loss_val

l_sum = l_sum/3

# 绘制方法一
fig = plt.figure()
#Axes3D是mpl_toolkits.mplot3d中的一个绘图函数
ax = Axes3D(fig)
# l_sum/3 平均平方损失
ax.plot_surface(w, b, l_sum, rstride=1, cstride=1, cmap='rainbow')
ax.set_xlabel("W")
ax.set_ylabel("B")
ax.set_zlabel("Loss")
plt.show()
结果显示
绘制方法2:
import numpy as np
import matplotlib.pyplot as plt
from matplotlib import cm
from matplotlib.ticker import LinearLocator


x_data = [1.0, 2.0, 3.0]
y_data = [2.0, 4.0, 6.0]

def forward(x):
    return x * w + b


def loss(x, y):
    y_pred = forward(x)
    return (y_pred - y) ** 2

# 穷举法
mse_list = []
W = np.arange(0.0, 4.1, 0.1)
B = np.arange(-2.0, 2.1, 0.1)
[w, b] = np.meshgrid(W, B)


l_sum = 0   # loss求和
for x_val, y_val in zip(x_data, y_data):
    loss_val = loss(x_val, y_val)
    l_sum += loss_val

l_sum = l_sum/3

# 绘制方法二
# Plot the surface.
fig, ax = plt.subplots(subplot_kw={"projection": "3d"})
surf = ax.plot_surface(w, b, l_sum, cmap=cm.coolwarm,
                       linewidth=0, antialiased=False)

# Customize the z axis.
ax.set_zlim(0, 35)
ax.zaxis.set_major_locator(LinearLocator(10))
# A StrMethodFormatter is used automatically
ax.zaxis.set_major_formatter('{x:.00f}')

# Add a color bar which maps values to colors.
fig.colorbar(surf, shrink=0.5, aspect=5)


ax.set_xlabel('w')
ax.set_ylabel('b')
ax.text2D(0.4, 0.92, "Cost Values", transform=ax.transAxes)
plt.show()
结果显示
本人是个初学者,写博客也是为了记录学习以及作业
借鉴博客: https://blog.csdn.net/bit452/category_10569531.html


