基于离散时间频率增益传感器的P级至M级PMU模型的实现(Matlab代码实现)
个人主页: 研学社的博客
欢迎来到本博客 ❤️ ❤️
博主优势: 博客内容尽量做到思维缜密,逻辑清晰,为了方便读者。
⛳ 座右铭:行百里者,半于九十。
本文目录如下:
目录
1 概述
2 运行结果
3 参考文献
4 Matlab代码实现
1 概述
低复杂度高精度P级到M级渐进式PMU模型,由Krzysztof Duda和Tomasz P. Zieliński设计。
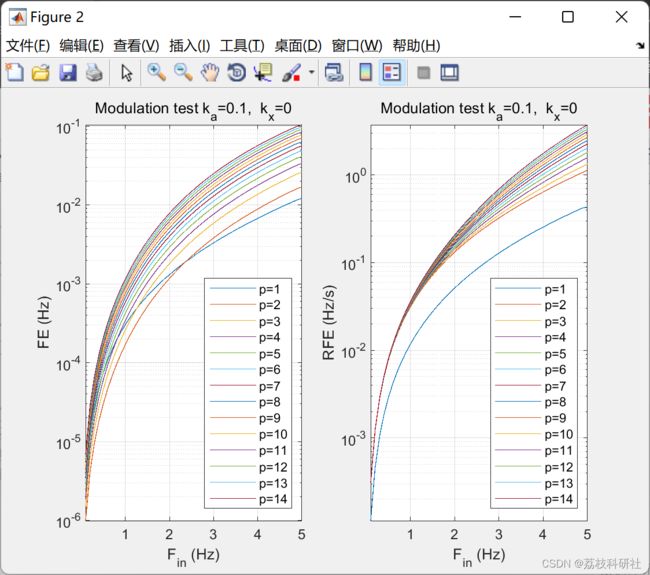
基于离散时间频率增益传感器(DTFGT)和正弦斜率滤波器的P级至M级渐进式PMU模型的实现,以及在IEC/IEEE 60255-118-1标准动态调制测试中的应用。
2 运行结果
部分代码:
figure,
subplot(1,2,1), hold on
plot(fm, err_TVE_dF)
legend(text_legend_const,'Location','southeast')
xlabel('F_i_n (Hz)'), ylabel('TVE (%) for straightforward A and \phi estimation')
title(text_title)
set(gca,'YScale','log'),
axis tight, box on, grid on
subplot(1,2,2), hold on
plot(fm, err_TVE_dF_LS, '-')
legend(text_legend_const,'Location','southeast')
xlabel('F_i_n (Hz) '), ylabel('TVE (%) for LS based A and \phi estimation')
title(text_title)
set(gca,'YScale','log'),
axis tight, box on, grid on
figure,
subplot(1,2,1), hold on
plot(fm, err_Om_dF, '-')
legend(text_legend_const,'Location','southeast')
xlabel('F_i_n (Hz)'), ylabel('FE (Hz)'), title(text_title)
set(gca,'YScale','log'),
axis tight, box on, grid on
subplot(1,2,2), hold on
plot(fm, err_Rocof_dF_LS, '-')
legend(text_legend_const,'Location','southeast')
xlabel('F_i_n (Hz)'), ylabel('RFE (Hz/s)'), title(text_title)
set(gca,'YScale','log'),
axis tight, box on, grid on
end
%###########################################################
function [Phasor, PhasorLS, Omr, ROCOFr] = PMU(x, P, N0, F0)
% PMU implementation with a cascade of rectangular filters
% and the Discrete-Time Frequency-Gain Transducer (DTFGT)
% with the sine-shape slope filter
% x - sinusoidal signal x=A*cos(Om*n+p)
% P - number of rectangular filters in the prefilter cascade
% Phasor - estimated complex phasor reported at nominal frequency with straightforward amplitude and phase estimation
% PhasorLS - estimated complex phasor reported at nominal frequency with LS based amplitude and phase estimation
% Omr - estimated frequency in radians reported at nominal frequency
% ROCOFr - estimated ROCOF in radians per second reported at nominal frequency
Nx = length(x);
Fs = N0*F0; %Hz
t = (0:Nx-1)/Fs;
y = x.*exp(-1i*2*pi*F0*t); % down-shifted sinusoidal signal x=A*cos(Om*n+p), Om=2*pi*f0/fs
%% for LS solution
ND2 = N0/2-1; % only one nominal period, although it could be more for longer cascade
ND1 = -N0/2;
%% sin frequency slope h = [1/2 0 -1/2];
w0= pi/(N0/2);
L = N0/4;
h = [1/2 zeros(1,L-1) 0 zeros(1,L-1) -1/2];
%%
tr = 1:N0:Nx; % reporting times
Phasor = zeros(length(tr), P);
PhasorLS = zeros(length(tr), P);
Omr = zeros(length(tr), P);
ROCOFr = zeros(length(tr), P);
r0 = ones(1,N0)/N0; rp = 1;
for ind=1:P
3 参考文献
部分理论来源于网络,如有侵权请联系删除。
[1]Krzysztof Duda (2023). P2M_PMU


