vue+echarts绘制中国地图,动态配置省份颜色和城市标点
最近做了一个需求,是绘制中国地图,要动态配置省份颜色和城市标点。写下这篇文章记录一下。
话不多说,上代码。
1、先写地图容器
2、设置容器的宽高度
#mapWrap{
  height: 100%;
  width: 100%
}
3、引入echarts、中国地图json
import echarts from 'echarts'
import '../../../../node_modules/echarts/map/js/china'
import chinaJson from '../../../../node_modules/echarts/map/json/china.json'
4、注册地图,初始化echarts
 echarts.registerMap('china', chinaJson) // 注册地图
 var mapChart = echarts.init(document.getElementById('mapWrap'))
5、配置地图配置项(最关键一步),详细配置说明都在代码里注释了
var option = {
        geo: { // 公共样式
          map: 'china',
          label: {
            normal: {
              show: false, // 显示省份标签
              textStyle: {
                color: '#000'
              } // 省份标签字体颜色
            }
          },
          itemStyle: {
            normal: {
              label: {show: false},
              borderWidth: 0.5, // 区域边框宽度
              borderColor: '#000', // 区域边框颜色
              areaColor: '#2E75B6' // 区域颜色
            }
          },
          emphasis: {
            label: {show: false},
            areaColor: '#F6C9AB' // 区域颜色
          },
          roam: true,
          zoom: 1.2 // 设置地图默认大小
        },
        visualMap: [
          { // 地图组件映射
            type: 'piecewise', // 定义为分段型 piecewise
            x: '-1000 px', // 图例横轴位置
            y: '-1000 px', // 图例纵轴位置
            seriesIndex: 0, // 指定系列数据
            splitList: this.splitList
          }
        ],
        backgroundColor: '#fff', // 图表背景色
        series: [
          {
            type: 'map', // 地图类型
            mapType: 'china',
            roam: true,
            geoIndex: 0,
            // nameMap: {
            //   '黑龙江': '哈尔滨'
            // },
            aspectScale: 0.75,
            data: this.provinceMapValue // 各省地图数据
          },
          {
            name: '二级公司', // series名称
            type: 'scatter', // 散点类型
            coordinateSystem: 'geo', // series坐标系类型
            label: {
              normal: {
                show: true, // 显示标签
                formatter: '{b}',
                position: [-5, 15],
                textStyle: {
                  color: '#000',
                  fontSize: 12,
                  fontFamily: 'Microsoft YaHei',
                  textBorderColor: '#fff',
                  textBorderWidth: 2
                } // 标签字体颜色
              }
            },
            data: this.secondaryCompany // 二级公司(城市公司)
          },
          {
            name: '城市管理中心', // series名称
            type: 'scatter', // series图表类型
            coordinateSystem: 'geo', // series坐标系类型
            label: {
              normal: {
                show: true, // 显示标签
                formatter: '{b}',
                position: [-5, 15],
                textStyle: {
                  color: '#000',
                  fontSize: 12,
                  fontFamily: 'Microsoft YaHei',
                  textBorderColor: '#fff',
                  textBorderWidth: 2
                } // 标签字体颜色
              }
            },
            data: this.cityManageCenter // 城市管理中心
          },
          {
            name: '平台公司', // series名称
            type: 'scatter', // series图表类型
            coordinateSystem: 'geo', // series坐标系类型
            label: {
              normal: {
                show: true, // 显示省份标签
                formatter: '{b}',
                position: [-10, 30],
                textStyle: {
                  color: '#D81E06',
                  fontSize: 12,
                  fontFamily: 'Microsoft YaHei',
                  textBorderColor: '#fff',
                  textBorderWidth: 2
                } // 标签字体颜色
              }
            },
            symbol: 'path://M215.4 160.6H177c-8.9 0-16 7.2-16 16V849c0 8.9 7.2 16 16 16h38.4c8.9 0 16-7.2 16-16V176.7c0.1-8.9-7.1-16.1-16-16.1zM848.1 236c-189 152.5-378-180.6-567.1-28.2-8.8 7.1-16 21.3-16 30.1v430.9c0 8.9 7.2 9 16 1.9 189-152.5 378.1 180.7 567.1 28.2 8.9-7.1 16-21.3 16-30.1V237.9c0.1-8.8-7.1-9-16-1.9z',
            symbolSize: 14,
            symbolOffset: ['50%', '-100%'],
            data: this.platformCompany // 平台公司
          },
          {
            name: '其他公司', // 其他公司
            type: 'scatter', // series图表类型
            coordinateSystem: 'geo', // series坐标系类型
            label: {
              normal: {
                show: true, // 显示省份标签
                formatter: '{b}',
                position: [-5, 15],
                textStyle: {
                  color: '#000',
                  fontSize: 12,
                  fontFamily: 'Microsoft YaHei',
                  textBorderColor: '#fff',
                  textBorderWidth: 2
                }
              }
            },
            // symbolSize: 3,
            data: this.otherCompany // 其他公司
          },
          {
            name: '平台公司原城市公司', // 平台公司原城市公司 isOldMgcenterCompany
            type: 'scatter', // series图表类型
            coordinateSystem: 'geo', // series坐标系类型
            label: this.oldCityLabel,
            data: this.isOldCityCompany
          },
          {
            name: '平台公司原管理中心', // 平台公司原管理中心
            type: 'scatter', // series图表类型
            coordinateSystem: 'geo', // series坐标系类型
            label: this.oldCityLabel,
            data: this.isOldMgcenterCompany
          }
        ]
}mapChart.setOption(option)6、配置点击事件,在点击公司名称可以跳转到公司详情页
 // 点击事件
 var that = this
 mapChart.on('click', function (params) {
    if (params.seriesName === '平台公司' || params.seriesName === '平台公司原城市公司' || params.seriesName === '平台公司原管理中心') {
      that.$router.push({name: 'cityDetails', query: {city: params.name, cityType: params.seriesName}})
    }
 })
7、设置宽度高度自适应,在屏幕分辨率切换时重新渲染
var h1 = document.documentElement.clientHeight // 获取屏幕的高度
mapChart.getDom().style.height = h1 - 100 + 'px'
mapChart.resize()
window.onresize = function() {
var h1 = document.documentElement.clientHeight // 获取屏幕的高度
mapChart.getDom().style.height = h1 - 100 + 'px'
mapChart.resize();
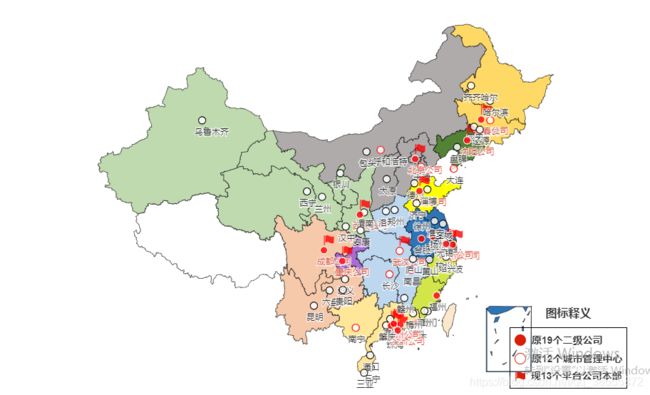
}最后效果展示: