绘制柱状图(四子图) 实验十六 matplotlib数据可视化 第5关
目录
本关任务
所需知识:
我的代码
答案代码实现:
本关任务:根据excel文件“类别销售”工作簿(tbsc/step2/类别销售.xlsx)的烟、零食、饮料、酒工作表的数据,找出销售数量合计最高的三种商品,建立条状图
所需知识:
1) 柱形图绘制、子图绘制、图例设置、横纵坐标参数显示
2) 读取excel文件
3) 相关方法:
plt类:
1) plt.figure(figsize=) #建立画布
2) plt.subplot(a,b,num) #分割子图 a行 b列 操作第num个
3) plt.bar() #建立条形
4) plt.lengend() #设置图例位置
5) plt.text() #显示条形高度
6) plt.xticks() #设置x轴参数
pd类:
1) pd.read_excel("filename", sheet_name = )
其他:
1) name.groupby(["name"])["name"].sum() #sum可以换很多种
2) sorted(name.items(), ket = lambda x:x[1], reverse = ) #按字典值排序并返回
a = {'a':2,'c':3,'b':99}
b = sorted(a.items(),key = lambda x:x[1], reverse = True)
print(b)

#[('b', 99), ('c', 3), ('a', 2)]
我的代码实现:
import matplotlib
matplotlib.use('Agg')
import matplotlib.pyplot as plt
import pandas as pd
import numpy as np

def read(name):            #读取excel
    df1 = pd.read_excel("tbsc/step2/类别销售.xlsx",sheet_name=name)
    num = dict(df1.groupby(["商品名称"])["数量"].sum())
    num1 = sorted(num.items(), key=lambda x:x[1], reverse = True)
    x = [i[0] for i in num1[:3]]
    y = [i[1] for i in num1[:3]]
    return [x,y]

#代码开始
matplotlib.rcParams['font.family']='SimHei'
matplotlib.rcParams['font.sans-serif'] = ['SimHei']

x1 = read("烟")[0]
y1 = read("烟")[1]


x2 = read("饮料")[0]
y2 = read("饮料")[1]


x3 = read("零食")[0]
y3 = read("零食")[1]

x4 = read("酒")[0]
y4 = read("酒")[1]


sj = [1,2,3]

plt.figure(figsize=(10,14))

plt.subplot(2,2,1)
plt.title("烟")
plt.bar(x=sj[0] , height=y1[0] , width=0.2, label = x1[0][1:])
plt.bar(x=sj[1] , height=y1[1] , width=0.2, label = x1[1][1:])
plt.bar(x=sj[2] , height=y1[2] , width=0.2, label = x1[2][1:])
plt.legend()                        #图例位置
for a, b in zip(sj, y1):            #柱高度
    plt.text(a, b+1, b)
plt.xticks(sj)                      #x轴显示 1 2 3

plt.subplot(2,2,2)
plt.title("饮料")
plt.bar(x=sj[0] , height=y2[0] , width=0.2, label = x2[0][1:])
plt.bar(x=sj[1] , height=y2[1] , width=0.2, label = x2[1][1:])
plt.bar(x=sj[2] , height=y2[2] , width=0.2, label = x2[2][1:])
plt.legend()
for a, b in zip(sj, y2):
    plt.text(a, b+1, b)
plt.xticks(sj)

plt.subplot(2,2,3)
plt.title("零食")
plt.bar(x=sj[0] , height=y3[0] , width=0.2, label = x3[0][1:])
plt.bar(x=sj[1] , height=y3[1] , width=0.2, label = x3[1][1:])
plt.bar(x=sj[2] , height=y3[2] , width=0.2, label = x3[2][1:])
plt.legend()
for a, b in zip(sj, y3):
    plt.text(a, b+1, b)
plt.xticks(sj)

plt.subplot(2,2,4)
plt.title("酒")
plt.bar(x=sj[0] , height=y4[0] , width=0.2, label = x4[0][1:])
plt.bar(x=sj[1] , height=y4[1] , width=0.2, label = x4[1][1:])
plt.bar(x=sj[2] , height=y4[2] , width=0.2, label = x4[2][1:])
plt.legend()
for a, b in zip(sj, y4):
    plt.text(a, b+1, b)
plt.xticks(sj)


plt.show()
#代码结束
plt.savefig("image5/lbzxt.jpg")
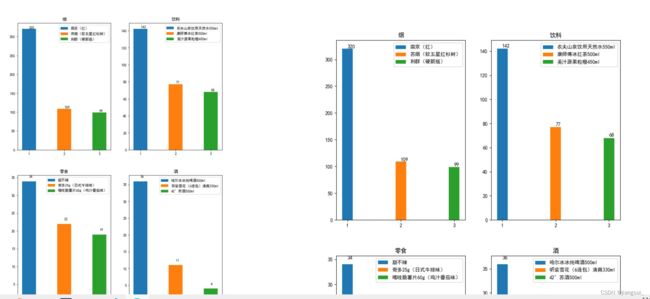
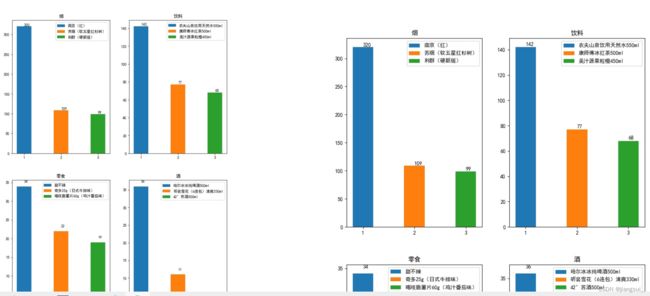
实现结果(右):
大小不对是缩放原因,放缩网页右图会变而左图不会
答案代码实现:
import matplotlib
matplotlib.use('Agg')
import matplotlib.pyplot as plt
import pandas as pd
import numpy as np

matplotlib.rcParams['font.family']='SimHei'
matplotlib.rcParams['font.sans-serif'] = ['SimHei']
plt.figure(figsize=(10,14))
lb=["烟","饮料","零食","酒"]
j=1
for x in lb:
    df=pd.read_excel("tbsc/step2/类别销售.xlsx",sheet_name=x)
    sj=df.groupby("商品名称")["数量"].sum()
    sj.sort_values(ascending=False,inplace=True)
    sj.index=sj.index.str.replace("\t","")
    #此处我是用切片将"\t"切掉的,因为读取excel后前面会有\t
    sp=sj[:3]
    plt.subplot(2,2,j)
    for i in range(0,3):
        plt.bar(x=i*0.5, height=sj[i],width=0.2,label=sj.index[i])
        plt.text(i*0.5,sj[i]+1,sj[i])
        #高度显示要求比柱子高1
    j=j+1
    plt.xticks([0,0.5,1],[1,2,3])
    plt.title(x)
    plt.legend()
#代码结束
plt.savefig("image5/lbzxt.jpg")
四个子图实现过程相似度高,灵活运用循环使代码变简洁。


