Matplotlib从入门到精通03-布局格式定方圆
Matplotlib从入门到精通03-布局格式定方圆
-
- 总结
- Matplotlib从入门到精通03-布局格式定方圆
-
- 导入依赖设置中文坐标轴负号
- Matplotlib绘制子图
-
- 1. 使用 plt.subplots 绘制均匀状态下的子图
- 2.使用subplot这样基于pyplot模式绘制子图
- 3. 使用 GridSpec 绘制非均匀子图
- 二子图上的方法
-
-
- 思考题
-
参考:
https://datawhalechina.github.io/fantastic-matplotlib/%E7%AC%AC%E4%B8%80%E5%9B%9E%EF%BC%9AMatplotlib%E5%88%9D%E7%9B%B8%E8%AF%86/index.html
https://matplotlib.org/stable/index.html
http://c.biancheng.net/matplotlib/data-visual.html
AI算法工程师手册
Task3:用极坐标系绘制玫瑰图&散点图和边际分布图的绘制
总结
本文主要是Matplotlib从入门到精通系列第3篇,本文介绍了Matplotlib的子图布局,同时介绍了较好的参考文档置于博客前面,读者可以重点查看参考链接。本系列的目的是可以完整的完成Matplotlib从入门到精通。重点参考连接

Matplotlib从入门到精通03-布局格式定方圆
导入依赖设置中文坐标轴负号
import numpy as np
import pandas as pd
import matplotlib.pyplot as plt
plt.rcParams['font.sans-serif'] = ['SimHei']   #用来正常显示中文标签
plt.rcParams['axes.unicode_minus'] = False   #用来正常显示负号
Matplotlib绘制子图
1. 使用 plt.subplots 绘制均匀状态下的子图
参考:https://matplotlib.org/stable/api/_as_gen/matplotlib.pyplot.subplots.html
matplotlib.pyplot.subplots(nrows=1, ncols=1, *, sharex=False, sharey=False, squeeze=True, width_ratios=None,
 height_ratios=None, subplot_kw=None, gridspec_kw=None, **fig_kw)
第一个数字为行,
第二个为列,不传入时默认值都为1
figsize 参数可以指定整个画布的大小
sharex 和 sharey 分别表示是否共享横轴和纵轴刻度
tight_layout 函数可以调整子图的相对大小使字符不会重叠
返回元素分别是画布和子图构成的列表,
fig:Figure
ax:Axes or array of Axes
返回值案例
# using the variable ax for single a Axes
fig, ax = plt.subplots()

# using the variable axs for multiple Axes
fig, axs = plt.subplots(2, 2)

# using tuple unpacking for multiple Axes
fig, (ax1, ax2) = plt.subplots(1, 2)
fig, ((ax1, ax2), (ax3, ax4)) = plt.subplots(2, 2)
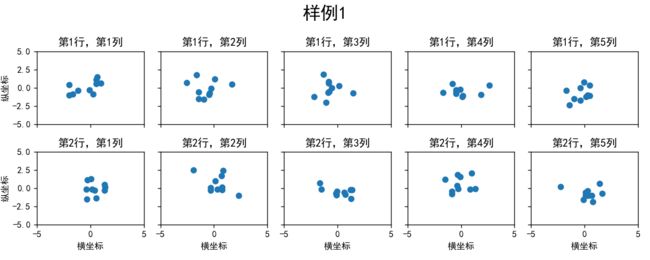
绘制多个整齐排列的子图
fig, axs = plt.subplots(2, 5, figsize=(10, 4), sharex=True, sharey=True)
fig.suptitle('样例1', size=20)
for i in range(2):
    for j in range(5):
        axs[i][j].scatter(np.random.randn(10), np.random.randn(10))
        axs[i][j].set_title('第%d行,第%d列'%(i+1,j+1))
        axs[i][j].set_xlim(-5,5)
        axs[i][j].set_ylim(-5,5)
        if i==1: axs[i][j].set_xlabel('横坐标')
        if j==0: axs[i][j].set_ylabel('纵坐标')
fig.tight_layout()

plt.show()
# fig.show()
# plt.pause(0)
subplots是基于OO模式的写法,显式创建一个或多个axes对象,然后在对应的子图对象上进行绘图操作。
2.使用subplot这样基于pyplot模式绘制子图
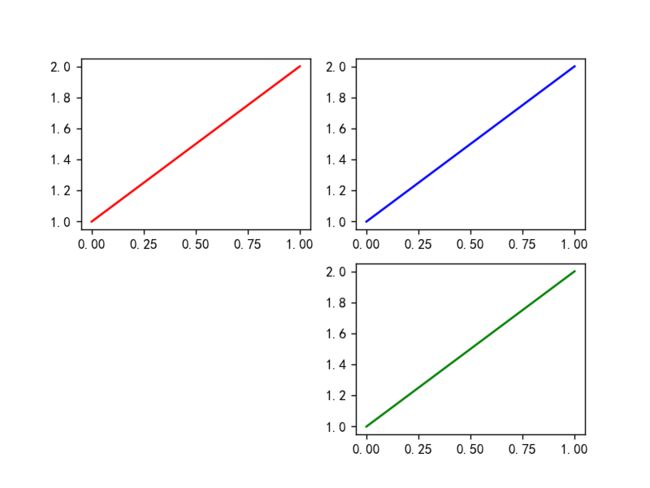
还有种方式是使用subplot这样基于pyplot模式的写法,每次在指定位置新建一个子图,并且之后的绘图操作都会指向当前子图,本质上subplot也是Figure.add_subplot的一种封装。
Add an Axes to the current figure or retrieve an existing Axes.
This is a wrapper of Figure.add_subplot which provides additional behavior when working with the implicit API (see the notes section).
matplotlib.pyplot.subplot(*args, **kwargs)
调用subplot案例
subplot(nrows, ncols, index, **kwargs)
subplot(pos, **kwargs)
subplot(**kwargs)
subplot(ax)
在调用subplot时一般需要传入三位数字,分别代表总行数,总列数,当前子图的index
plt.figure()
# 子图1
plt.subplot(2,2,1)
plt.plot([1,2], 'r')
# 子图2
plt.subplot(2,2,2)
plt.plot([1,2], 'b')
#子图3
plt.subplot(224)  # 当三位数都小于10时,可以省略中间的逗号,这行命令等价于plt.subplot(2,2,4)
plt.plot([1,2], 'g')

plt.show()
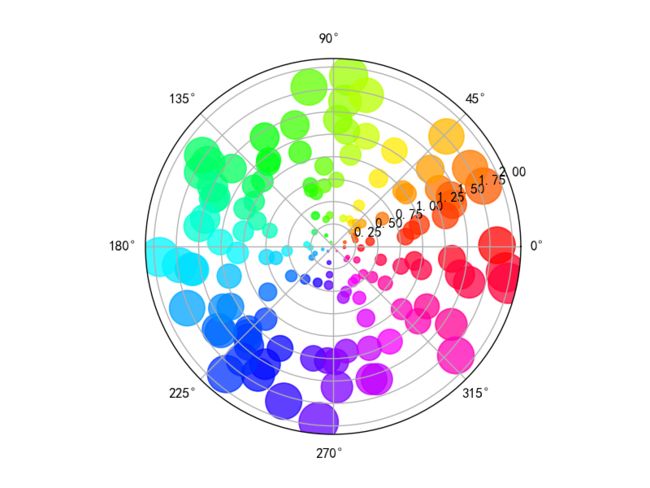
除了常规的直角坐标系,也可以通过projection方法创建极坐标系下的图表
import copy
N = 150
r = copy.deepcopy(2 * np.random.rand(N))
theta = copy.deepcopy(2 * np.pi * np.random.rand(N))
print('theta.size:{}--theta[0:5]{}\n'.format(theta.size,theta[0:5],theta.max()))
print('theta.max:{}\n'.format(theta.max()))
# theta.size:150--theta[0:5][4.79750376 4.7365522  4.15253206 5.10639503 2.18095445]
# theta.max:6.277904493717284
area = copy.deepcopy(200 * r**2)
print('area.size:{}--area[0:5]{}\n'.format(area.size,area[0:5],area.max()))
print('area.max:{}\n'.format(area.max()))
# area.size:150--area[0:5][659.7790882  179.13939507 219.69376541  39.21408373  82.3782166 ]
# area.max:790.7976635649974
colors = theta


plt.subplot(projection='polar')
plt.scatter(theta, r, c=colors, s=area, cmap='hsv', alpha=0.75)

plt.show()
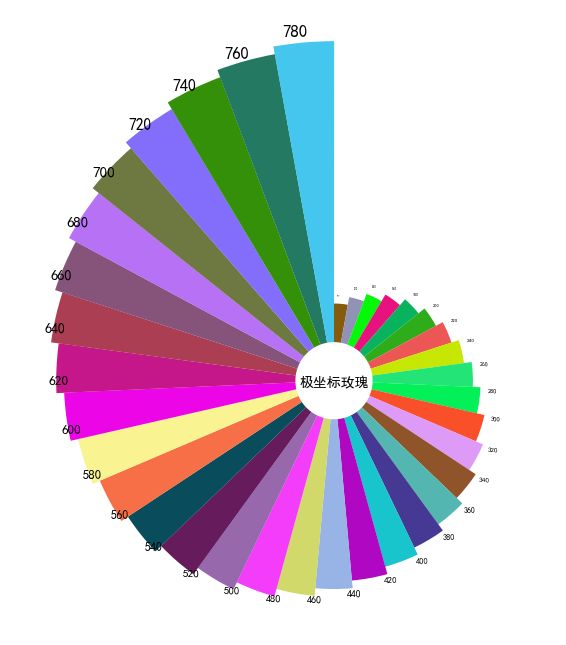
请思考如何用极坐标系画出类似的玫瑰图
fig = plt.figure(figsize=(10, 6))
ax = plt.subplot(111, projection='polar')
ax.set_theta_direction(-1) # 顺时针
ax.set_theta_zero_location('N') # NSWE
r = np.arange(100, 800, 20)
theta = np.linspace(0, np.pi * 2, len(r), endpoint=False)
print(theta,"--------------")
"""
[0.         0.17951958 0.35903916 0.53855874 0.71807832 0.8975979
 1.07711748 1.25663706 1.43615664 1.61567622 1.7951958  1.97471538
 2.15423496 2.33375454 2.51327412 2.6927937  2.87231328 3.05183286
 3.23135244 3.41087202 3.5903916  3.76991118 3.94943076 4.12895034
 4.30846992 4.48798951 4.66750909 4.84702867 5.02654825 5.20606783
 5.38558741 5.56510699 5.74462657 5.92414615 6.10366573] --------------
"""
ax.bar(theta, r, width=0.18, color=np.random.random((len(r), 3)),
       align='edge', bottom=100)
ax.text(np.pi * 3 / 2 - 0.2, 90, '极坐标玫瑰', fontsize=8)
for angle, height in zip(theta, r):
    ax.text(angle + 0.03, height + 120, str(height), fontsize=height / 80)
plt.axis('off')
plt.tight_layout()
plt.show()
3. 使用 GridSpec 绘制非均匀子图
参考:https://matplotlib.org/stable/api/_as_gen/matplotlib.pyplot.figure.html
所谓非均匀包含两层含义,第一是指图的比例大小不同但没有跨行或跨列,第二是指图为跨列或跨行状态
利用 add_gridspec 可以指定相对宽度比例 width_ratios 和相对高度比例参数 height_ratios
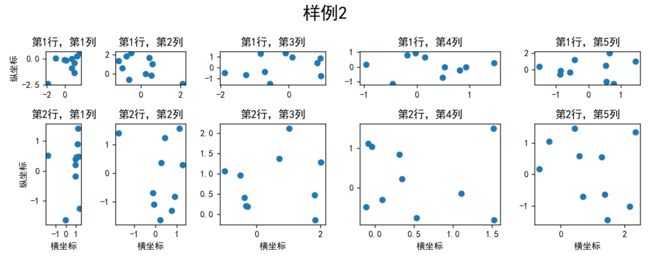
fig = plt.figure(figsize=(10, 4))
spec = fig.add_gridspec(nrows=2, ncols=5, width_ratios=[1,2,3,4,3], height_ratios=[1,3])
print(spec) # GridSpec(2, 5, height_ratios=[1, 3], width_ratios=[1, 2, 3, 4, 5])
print(spec[9]) # GridSpec(2, 5, height_ratios=[1, 3], width_ratios=[1, 2, 3, 4, 5])[1:2, 4:5]
fig.suptitle('样例2', size=20)
for i in range(2):
    for j in range(5):
        ax = fig.add_subplot(spec[i, j])
        ax.scatter(np.random.randn(10), np.random.randn(10))
        ax.set_title('第%d行,第%d列'%(i+1,j+1))
        if i==1: ax.set_xlabel('横坐标')
        if j==0: ax.set_ylabel('纵坐标')
fig.tight_layout()

plt.show()
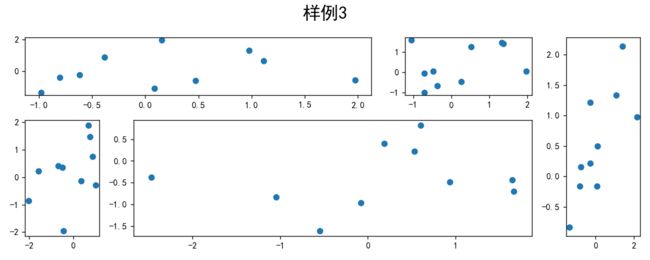
在上面的例子中出现了 spec[i, j] 的用法,事实上通过切片就可以实现子图的合并而达到跨图的功能
fig = plt.figure(figsize=(10, 4))
spec = fig.add_gridspec(nrows=2, ncols=6, width_ratios=[2,2.5,3,1,1.5,2], height_ratios=[1,2])
fig.suptitle('样例3', size=20)
# sub1
ax = fig.add_subplot(spec[0, :3])
ax.scatter(np.random.randn(10), np.random.randn(10))
# sub2
ax = fig.add_subplot(spec[0, 3:5])
ax.scatter(np.random.randn(10), np.random.randn(10))
# sub3
ax = fig.add_subplot(spec[:, 5])
ax.scatter(np.random.randn(10), np.random.randn(10))
# sub4
ax = fig.add_subplot(spec[1, 0])
ax.scatter(np.random.randn(10), np.random.randn(10))
# sub5
ax = fig.add_subplot(spec[1, 1:5])
ax.scatter(np.random.randn(10), np.random.randn(10))
fig.tight_layout()

plt.show()
二子图上的方法
补充介绍一些子图上的方法
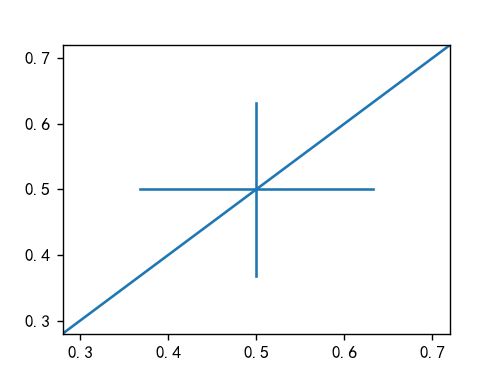
常用直线的画法为: axhline, axvline, axline (水平、垂直、任意方向)
fig, ax = plt.subplots(figsize=(4,3))
ax.axhline(0.5,0.2,0.8)
ax.axvline(0.5,0.2,0.8)
ax.axline([0.3,0.3],[0.7,0.7])

plt.show()
使用 set_xscale 可以设置坐标轴的规度(指对数坐标等)
fig, axs = plt.subplots(1, 2, figsize=(10, 4))
for j in range(2):
    axs[j].plot(list('abcd'), [10**i for i in range(4)])
    if j==0:
        axs[j].set_yscale('log') #  'linear', 'log', 'symlog', 'asinh', 'logit', 'function', 'functionlog'
    else:
        pass
fig.tight_layout()

plt.show()
思考题
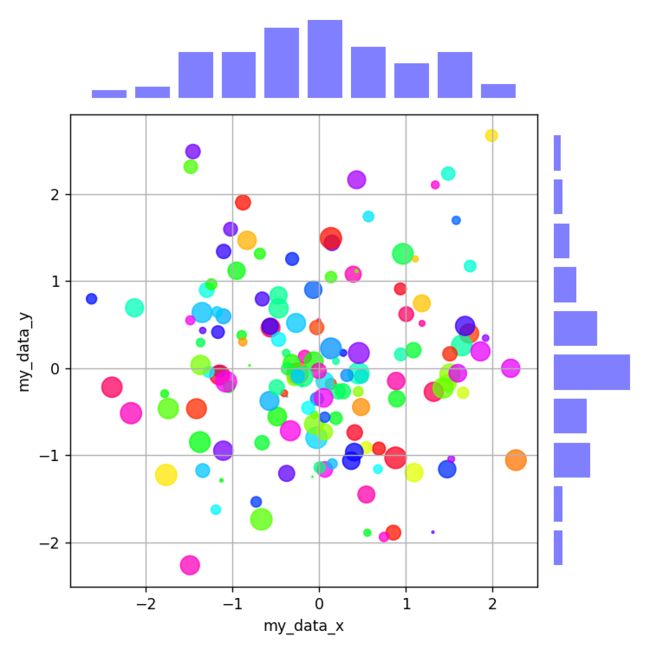
用 np.random.randn(2, 150) 生成一组二维数据,使用两种非均匀子图的分割方法,做出该数据对应的散点图和边际分布图

解题办法:
参考:https://blog.csdn.net/YangTinTin/article/details/122592342
方法1,不跨行:
import numpy as np
from matplotlib import pyplot as plt
from matplotlib import gridspec
data=np.random.randn(2, 150)
fig = plt.figure(figsize=(6,6))
spec = gridspec.GridSpec(nrows=2, ncols=2, width_ratios=[5,1], height_ratios=[1,5])
## 使用过fig.add_gridspec 报错,,就没使用
#子图1
ax=fig.add_subplot(spec[0,0])
ax.hist(data[0,:],bins=10,rwidth=0.8,color='b',alpha=0.5) # rwidth=0.8 设置柱子宽度百分比,防止挨在一起
for word in ['right','left','top','bottom']:
    ax.spines[word].set_visible(False) #边框不可见
ax.get_xaxis().set_visible(False) # x轴不可见
ax.get_yaxis().set_visible(False) # y轴不可见
#子图3
ax=fig.add_subplot(spec[1,0])
# 设置点的形状、大小,颜色
area=200*np.random.rand(150)
colors=np.random.rand(150)
#ax.scatter(data[0,:],data[1,:],color='r',marker='*',s=area)  # 只有一种颜色时,用c或color都可,多种颜色,用参数c
ax.scatter(data[0,:],data[1,:],c=colors,marker='o',s=area,cmap='hsv',alpha=0.75)#cmap 色谱
ax.grid(True)
ax.set_xlabel('my_data_x')
ax.set_ylabel('my_data_y')
#子图4
ax=fig.add_subplot(spec[1,1])
ax.hist(data[1,:],orientation='horizontal',bins=10,rwidth=0.8,color='b',alpha=0.5)
for word in ['right','left','top','bottom']:
    ax.spines[word].set_visible(False)
ax.get_xaxis().set_visible(False) # x轴不可见
ax.get_yaxis().set_visible(False) # y轴不可见
plt.tight_layout()

plt.show()
方法2 跨行
import numpy as np
from matplotlib import pyplot as plt
from matplotlib import gridspec
data=np.random.randn(2, 150)
fig = plt.figure(figsize=(6,6))
spec = gridspec.GridSpec(nrows=6, ncols=6, width_ratios=[1,1,1,1,1,1], height_ratios=[1,1,1,1,1,1])
## 使用过fig.add_gridspec 报错,,就没使用
#子图1
ax=fig.add_subplot(spec[0,:5])
ax.hist(data[0,:],bins=10,rwidth=0.8,color='b',alpha=0.5) # rwidth=0.8 设置柱子宽度百分比,防止挨在一起
for word in ['right','left','top','bottom']:
    ax.spines[word].set_visible(False) #边框不可见
ax.get_xaxis().set_visible(False) # x轴不可见
ax.get_yaxis().set_visible(False) # y轴不可见
#子图3
ax=fig.add_subplot(spec[1:,:5])
# 设置点的形状、大小,颜色
area=200*np.random.rand(150)
colors=np.random.rand(150)
#ax.scatter(data[0,:],data[1,:],color='r',marker='*',s=area)  # 只有一种颜色时,用c或color都可,多种颜色,用参数c
ax.scatter(data[0,:],data[1,:],c=colors,marker='o',s=area,cmap='hsv',alpha=0.75)#cmap 色谱
ax.grid(True)
ax.set_xlabel('my_data_x')
ax.set_ylabel('my_data_y')
#子图4
ax=fig.add_subplot(spec[1:,5:6])
ax.hist(data[1,:],orientation='horizontal',bins=10,rwidth=0.8,color='b',alpha=0.5)
for word in ['right','left','top','bottom']:
    ax.spines[word].set_visible(False)
ax.get_xaxis().set_visible(False) # x轴不可见
ax.get_yaxis().set_visible(False) # y轴不可见
plt.tight_layout()

plt.show()
