利用python从全球.nc数据/站点数据中提取中国区域数据
文章目录
- 一、利用shape 、Point和相应的中国shp文件逐点判断
- 二、利用rioxarray、geopandas和中国shp文件mask中国以外的区域
一、利用shape、Point和相应的中国shp文件逐点判断?
任务背景:从471个站点数据中根据站点的经纬度信息来判断是否是中国区域内站点,get_china_station() 返回的的在中国内的站点经纬度
import numpy as np
import os
import pandas as pd
import time
import matplotlib.pyplot as plt
import pickle
import code
import matplotlib
import shapefile
from shapely.geometry import shape, Point

def get_china_station(dir_data, shp_file):
    '''
    Parameters
    ----------
    dir_data : 数据路径
    Returns
    -------
    lonlat 中国测站经纬度
    其中删除了缺测数据
    '''
    with open(dir_data, 'rb') as f:
        sample_list = pickle.loads(f.read())  # sample_list[ 时间][站点]
    lon_all=[]#471个站点所有lon
    lat_all=[]#471个站点所有lon
    for i in range(0, len(sample_list[0])):  # 471个站点
            lon_all.append(sample_list[0][i]['labels']['longitude'])
            lat_all.append(sample_list[0][i]['labels']['latitude'])
    # read your shapefile
    r = shapefile.Reader(shp_file)
    # get the shapes
    shapes = r.shapes()
    # build a shapely polygon from your shape
    polygon = shape(shapes[0])
    lon_china=[]
    lat_china=[]
    for i in range(len(lon_all)):
        point = Point(lon_all[i], lat_all[i])
        if polygon.contains(point):
            lon_china.append(lon_all[i])
            lat_china.append(lat_all[i])

    return lon_china,lat_china


if __name__ == "__main__":
    print('==========================程序 开始=================================================')
    t0 = time.time()
    # =====read data and process data===============
    #=========024===========
    pk_file_024 = "Dataset_024.pickle"
    shp_file='china_country.shp'
    lon,lat = get_china_station(pk_file_024,shp_file)  # xshape:[sample,32,3,3] y shape[sample]
    np.savez('lonlat_stationinchina.npz',lon=lon,lat=lat)
    print('==========================程序 结束|  耗时:  %s ================================' % (time.time() - t0))
    code.interact(local=locals())
二、利用rioxarray、geopandas和中国shp文件mask中国以外的区域
任务背景:从全球的.nc数据中只保留中国区域的数据
#==基本处理数据的包====
import os
import time
import code
import numpy as np
import pandas as pd
import xarray as xr
#====截取中国区域用到的包=====
import rioxarray
import geopandas
from shapely.geometry import mapping
#=画图需要的包
import matplotlib as mpl
from matplotlib.colors import LogNorm
from mpl_toolkits.basemap import Basemap, cm, shiftgrid, addcyclic
import matplotlib.pyplot as plt

def SelectChina(ds):
    '''
    说明:要用rioxarray  geopandas两个包 直接pip install 就行
    '''
    ds.rio.set_spatial_dims(x_dim="lon", y_dim="lat", inplace=True)
    ds.rio.write_crs("EPSG:4326", inplace=True)
    #==加载shp文件
    geodf = geopandas.read_file("china_country.shp")
    # 利用shp裁剪
    clipped = ds.rio.clip(geodf.geometry.apply(mapping), geodf.crs)
    # # 将文件保存为nc格式
    # clipped.to_netcdf('%s%s.nc' % (paths, names), mode='w', format="NETCDF4")
    return clipped

def ReadGCPP10FixChina():
    '''
    读取1°分辨率的GCPP资料(先通过CDO进行数据拼接了)
    返回6 7 8 三个月平均
    lon[360] -179.5:179.5:1 lat[180] 89.5:-89.5:1
    '''
    t0ReadGCPP10 = time.time()
    print('*****************函数ReadGCPP10FixChina开始*********************')
    DataPath = 'CPP/All_full_data_monthly_v2022_2011_10.nc'
    Data = xr.open_dataset(DataPath)
    #=逐月平均====
    DataMonAve = Data.groupby('time.month').mean('time')
    #=只选择中国区域=
    DataMonAveChina = SelectChina(DataMonAve)
    DataMonAveChina6 = DataMonAveChina.precip[5]
    DataMonAveChina7 = DataMonAveChina.precip[6]
    DataMonAveChina8 = DataMonAveChina.precip[7]
    Lon = DataMonAve.lon.values
    Lat = DataMonAve.lat.values
    print('***********************函数ReadGCPP10FixChina结束, 耗时: %.3f s / %.3f mins****************' % ( (time.time() - t0ReadGCPP10), (time.time() - t0ReadGCPP10) / 60))
    return DataMonAveChina6, DataMonAveChina7, DataMonAveChina8, Lat, Lon

if __name__ == "__main__":
    t0 = time.time()
    # ===================================================================================
    print('*****************程序开始*********************' )
    #==读取GCPP 1°分辨率的降水数据
    DataMonAve6, DataMonAve7, DataMonAve8, Lat, Lon = ReadGCPP10()
    DataMonAveChina6, DataMonAveChina7, DataMonAveChina8, LatChina, LonChina = ReadGCPP10FixChina()

    print('***********************程序结束, 耗时: %.3f s / %.3f mins****************' % ((time.time() - t0), (time.time() - t0) / 60))
    code.interact(local=locals())
结果展示:原始数据(以DataMonAve8为例):
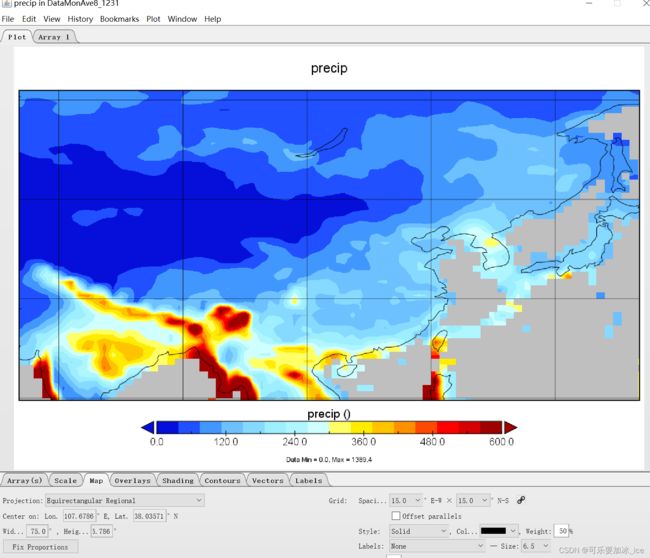
mask(相应的DataMonAveChina8)之后:
