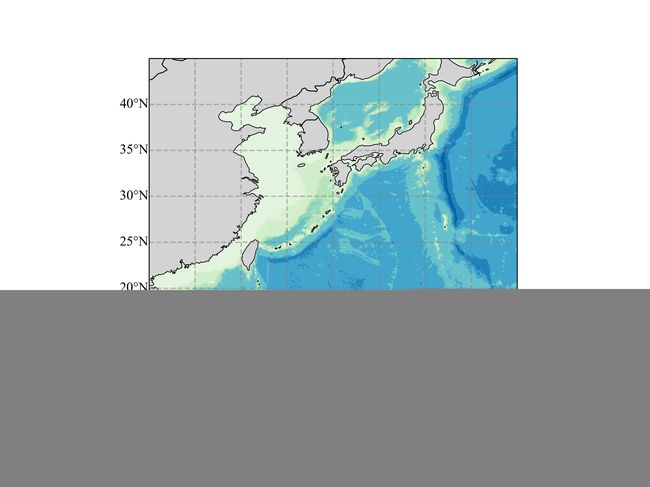
利用Python+xarray+cartopy+matplotlib 实现遥感地形图制图绘制 —— xarray 学习文档01
1. xarray
xarray是针对 “.nc” 等格式数据的处理软件,可以差值、可视化、合并等等操作!!!简单易上手
学习文档:xarray
安装:
pip install xarray
conda install xarray
2. xarray.plot() 数据可视化
以"海底地形数据"为例,只显示了中国东部海、中国南海以及西北太平洋等区域,也可以全球范围内
import xarray as xr
import cartopy.crs as ccrs
import cartopy.feature as cfeat
import numpy as np
from cartopy.mpl.gridliner import LONGITUDE_FORMATTER, LATITUDE_FORMATTER, mticker
import matplotlib.pyplot as plt

depth = xr.open_dataset(r"***\DEP\GEBCO_2021.nc")
data = dep['elevation']

lon = depth.lon
lat = depth.lat
lon_range = lon[(lon>=110)&(lon <=150)]
lat_range = lat[(lat >=5)& (lat<=45)]
dep = depth.sel(lat = lat_range,lon = lon_range)

fig = plt.figure(figsize=(8,6),dpi=600)
ax = fig.add_subplot(1, 1, 1, projection=ccrs.PlateCarree())
# 设置地图属性:加载国界、海岸线,land 为灰色
ax.add_feature(cfeat.OCEAN, zorder=0,color = 'white',edgecolor='black')
ax.add_feature(cfeat.LAND,  color = 'grey',zorder=1,edgecolor='black')
ax.add_feature(cfeat.BORDERS.with_scale('50m'), linewidth=0.8, zorder=1)
ax.add_feature(cfeat.COASTLINE.with_scale('50m'), linewidth=0.6, zorder=1)
ax.set_extent([110, 150,5, 45],crs = ccrs.PlateCarree())
# 设置网格点属性
gl = ax.gridlines(crs=ccrs.PlateCarree(), draw_labels=True, linewidth=1.2, color='gray', alpha=0.5, linestyle='--')
gl.top_labels = False   #关闭顶端标签
gl.right_labels = False #关闭右侧标签
gl.xlocator = mticker.FixedLocator([110,115,120,125,130,135,140,145,150])
gl.xformatter = LONGITUDE_FORMATTER#x轴设为经度格式
gl.xlabel_style = {'size':12, 'color': 'k','rotation':0}
gl.yformatter = LATITUDE_FORMATTER#y轴设为纬度格式
gl.ylocator = mticker.FixedLocator([5,10,15,20,25,30,35,40,45])
gl.ylabel_style = {'size':12,'rotation':0}
level = [-10000,-8000,-6000,-4000,-1500,-1000,-500,-100,0]

# 画图
im = data.plot(ax=ax, cmap='GnBu_r',vmin=-10000,vmax=0,levels = level,add_colorbar = False)#cbar_kwargs=cbar_kwargs,transform=ccrs.PlateCarree())
position2=fig.add_axes([0.22, 0.04, 0.57, 0.018])#位置[左,下,右,上]  0.25, 0.35, 0.5, 0.014
cb=plt.colorbar(im,cax=position2,orientation='horizontal')#方向
position2.set_title('Topography(m)',loc = 'center',fontsize=15,weight = 'normal')
