plt模块绘制子图
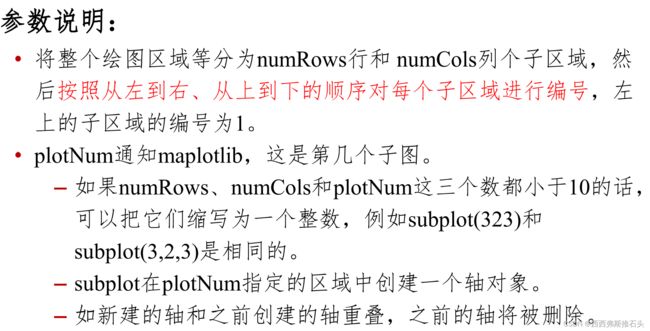
绘制函数plt.subplot()函数
简介
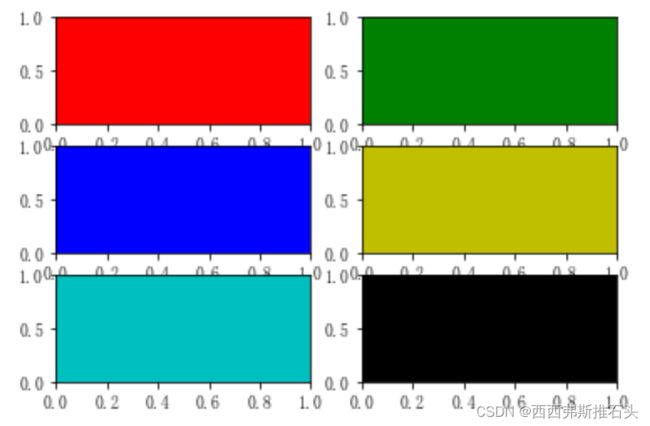
给每个子图配色,可以使用enumerate函数枚举
例题:绘制多个颜色的子图
#绘制多轴图
import numpy as np
import matplotlib.pyplot as plt
%matplotlib inline
for idx, color in enumerate("rgbyck"):
    plt.subplot(320+idx+1,facecolor = color)
plt.show()
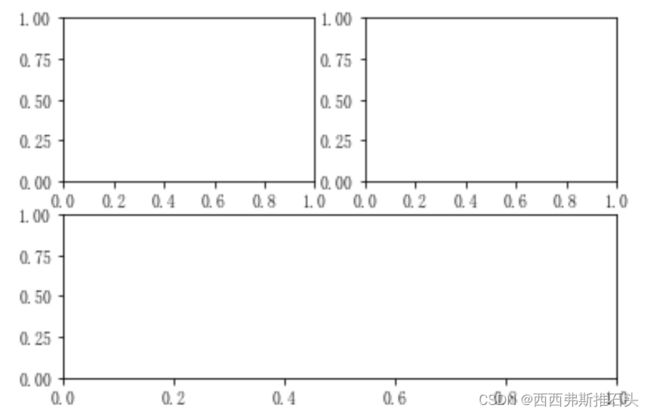
绘制多轴图
import numpy as np
import matplotlib.pyplot as plt
#行,列,编号
plt.subplot(221) # 第一行的左图
plt.subplot(222) # 第一行的右图
plt.subplot(212) # 第二整行
plt.show()
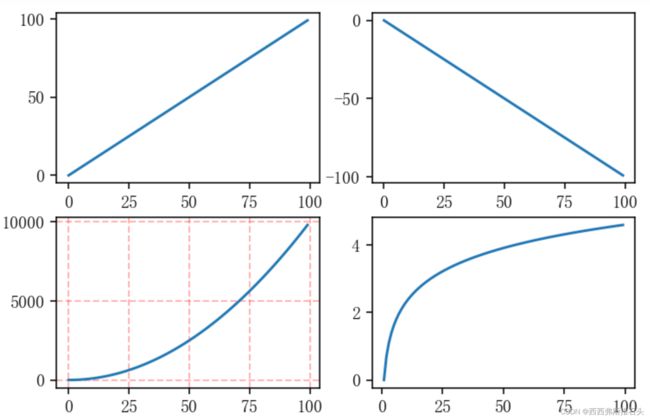
例题:在不同的子图中绘图
%matplotlib qt5

import numpy as np
import matplotlib.pyplot as plt
x = np.arange(0, 100)

#作图1
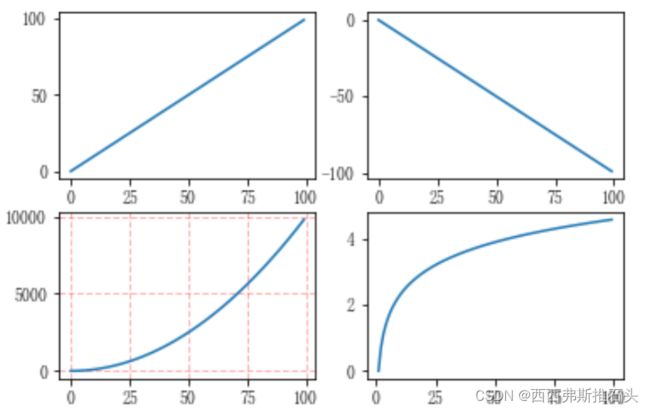
plt.subplot(221)
plt.plot(x, x)

#作图2
plt.subplot(222)
plt.plot(x, -x)

#作图3
plt.subplot(223)
plt.plot(x, x ** 2)
plt.grid(color='r', linestyle='--', linewidth=1,alpha=0.3)

#作图4
plt.subplot(224)
plt.plot(x, np.log(x))

plt.show()
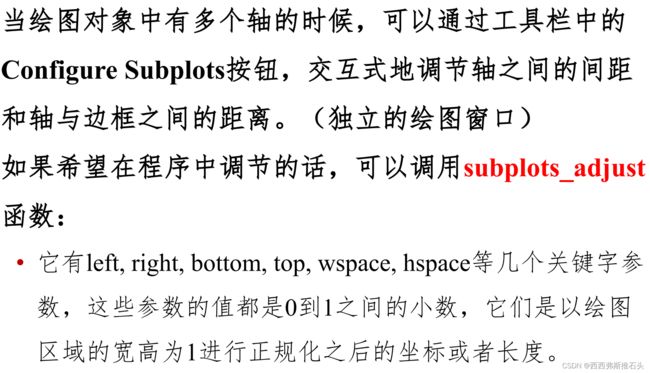
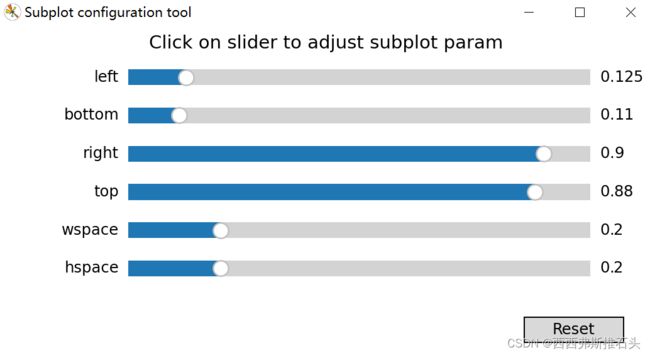
调节轴之间的间距、轴与边框之间的距离
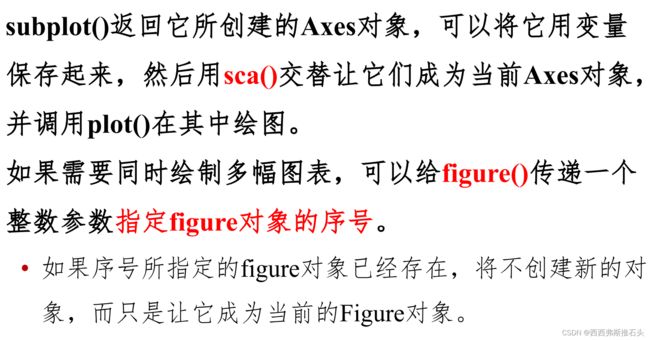
在各个子图之间切换
import numpy as np
import matplotlib.pyplot as plt

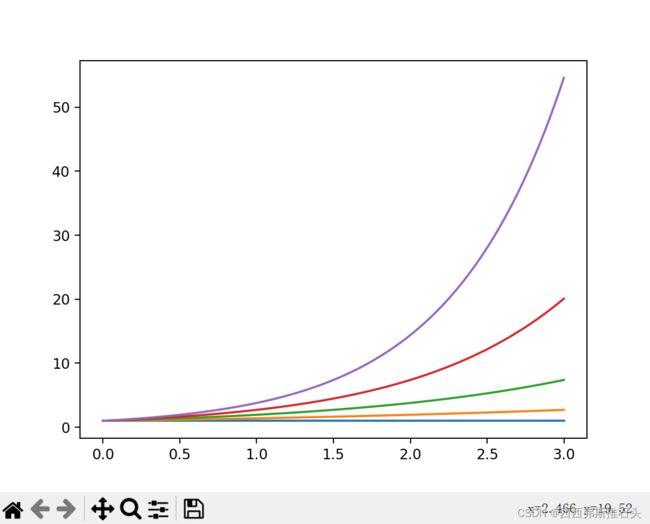
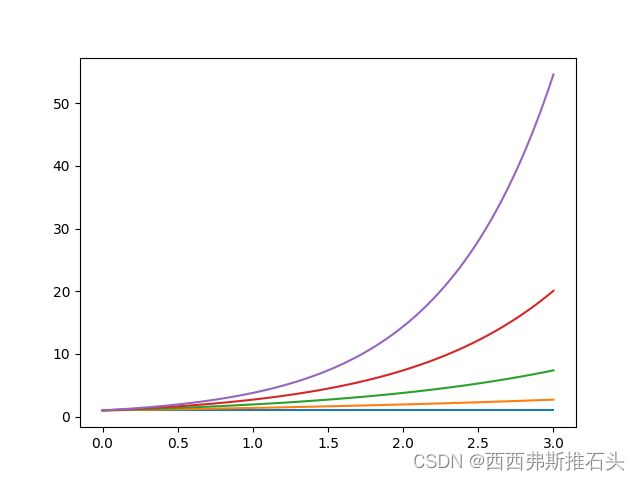
plt.figure(1) # 创建图表1

plt.figure(2) # 创建图表2
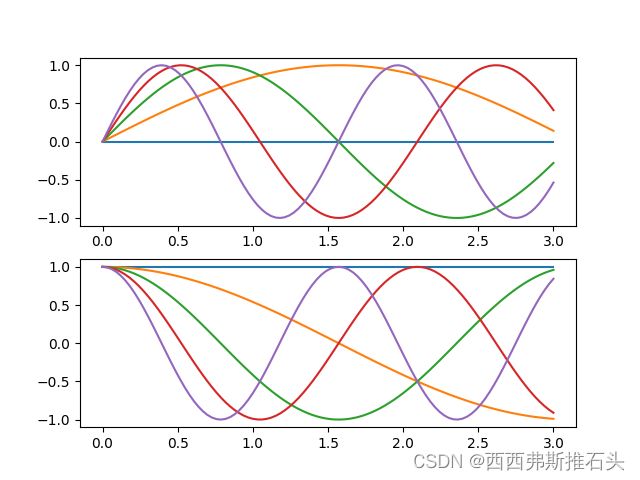
ax1 = plt.subplot(211) # 在图表2中创建子图1,保存为ax1
ax2 = plt.subplot(212) # 在图表2中创建子图2,保存为ax2

x = np.linspace(0, 3, 100)
for i in range(5):
    plt.figure(1) # 已存在,直接选择图表1
    plt.plot(x, np.exp(i*x/3))
    plt.sca(ax1) # plt.sca()函数选择图表2的子图1
    plt.plot(x, np.sin(i*x))
    plt.sca(ax2) # plt.sca()函数选择图表2的子图2
    plt.plot(x, np.cos(i*x))
plt.show()
展示结果:
同时创建多个子图
#fig,axes=plt.subplots(n,m)
import numpy as np
import matplotlib.pyplot as plt

x = np.arange(0, 100)
#划分子图
fig,axes=plt.subplots(2,2)
ax1=axes[0,0]
ax2=axes[0,1]
ax3=axes[1,0]
ax4=axes[1,1]


#作图1
ax1.plot(x, x)
#作图2
ax2.plot(x, -x)
 #作图3
ax3.plot(x, x ** 2)
ax3.grid(color='r', linestyle='--', linewidth=1,alpha=0.3)
#作图4
ax4.plot(x, np.log(x))
plt.show()
