Web GIS系列:
1.搭建简易Web GIS网站:使用GeoServer+PostgreSQL+PostGIS+OpenLayers3
2.使用GeoServer+QGIS发布WMTS服务
3.使用GeoServer+OpenLayers发布和调用WMTS、Vector Tile矢量切片服务 .
4.Leaflet入门:添加点线面并导入GeoJSON数据
上一篇文章介绍了如何发布WMTS服务,这篇文章将继续介绍如何调用WMTS服务。此外,还将介绍如何发布和调用矢量切片服务。
调用WMTS服务
OpenLayers3中提供了调用WMTS服务的接口。其主要思想是先构建切片信息,再传入服务信息即可。切片信息包括切片名、切片大小、切片范围等。这些切片信息都可以在GeoServer中Gridsets中找到,按照其中的切片信息构建相应的请求方法即可。
具体代码如下:
        //切片名
        var gridNames = ['EPSG:4326:0', 'EPSG:4326:1', 'EPSG:4326:2', 'EPSG:4326:3', 'EPSG:4326:4', 'EPSG:4326:5', 'EPSG:4326:6', 'EPSG:4326:7', 'EPSG:4326:8', 'EPSG:4326:9', 'EPSG:4326:10', 'EPSG:4326:11', 'EPSG:4326:12', 'EPSG:4326:13', 'EPSG:4326:14', 'EPSG:4326:15', 'EPSG:4326:16', 'EPSG:4326:17', 'EPSG:4326:18', 'EPSG:4326:19', 'EPSG:4326:20', 'EPSG:4326:21'];
        //切片大小
        var resolutions = [0.703125, 0.3515625, 0.17578125, 0.087890625, 0.0439453125, 0.02197265625, 0.010986328125, 0.0054931640625, 0.00274658203125, 0.001373291015625, 6.866455078125E-4, 3.4332275390625E-4, 1.71661376953125E-4, 8.58306884765625E-5, 4.291534423828125E-5, 2.1457672119140625E-5, 1.0728836059570312E-5, 5.364418029785156E-6, 2.682209014892578E-6, 1.341104507446289E-6, 6.705522537231445E-7, 3.3527612686157227E-7];
        //设置地图投影
        var projection = new ol.proj.Projection({
            code: 'EPSG:4326',//投影编码
            units: 'degrees',
            axisOrientation: 'neu'
        });

        //OSM地图
        var osmMap = new ol.layer.Tile({
            source: new ol.source.OSM()
        });

        //地图
        var map = new ol.Map({
            layers: [
                osmMap,
                new ol.layer.Tile({
                    source: new ol.source.WMTS({
                        //服务地址
                        url: 'http://localhost:8080/geoserver/gwc/service/wmts',
                        layer: 'your_layer_name',
                        //切片集
                        matrixSet: 'EPSG:4326',
                        format: 'image/png',
                        projection: projection,
                        //切片信息
                        tileGrid: new ol.tilegrid.WMTS({
                            tileSize: [256, 256],
                            extent: [-180.0, -90.0, 180.0, 90.0],//范围
                            origin: [-180.0, 90.0],
                            resolutions: resolutions,
                            matrixIds: gridNames,
                        }),
                        //
                        style: 'KYH:CHINA',
                        wrapX: true
                    })
                })
            ],
            target: 'map2',
            controls: ol.control.defaults({
                attributionOptions: /** @type {olx.control.AttributionOptions} */ ({
                    collapsible: false
                })
            }),
            view: new ol.View({
                projection: projection,
            })
        });

        map.getView().fit(bounds, map.getSize());
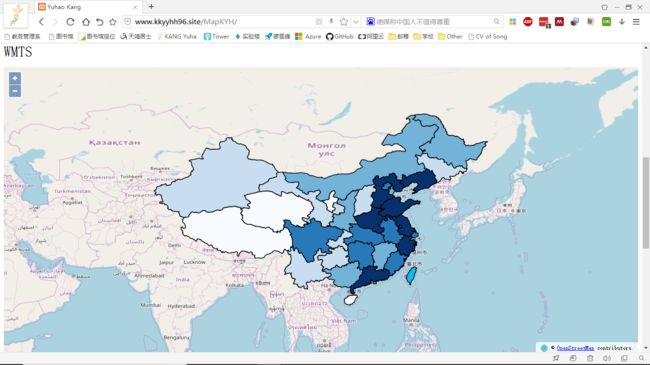
从中我们可以看到首先设置了切片名,切片大小等,之后新建一个ol.tilegrid.WMTS,将切片信息传入,即可调用WMTS地图服务。
效果如图:
发布矢量切片Vector Tile服务
发布矢量切片Vector Tile服务可以参考官方文档:安装矢量切片插件
在这里,GeoServer是以插件的形式提供矢量切片发布服务的。方法是前往GeoServer官方网站中的下载页面,在其中找到相对应的版本,找到插件列表中的Vector Tile即可下载。下载完成后,解压缩,将4个jar文件拷贝到GeoServer/WEB-INF/lib中即可。之后重启服务。
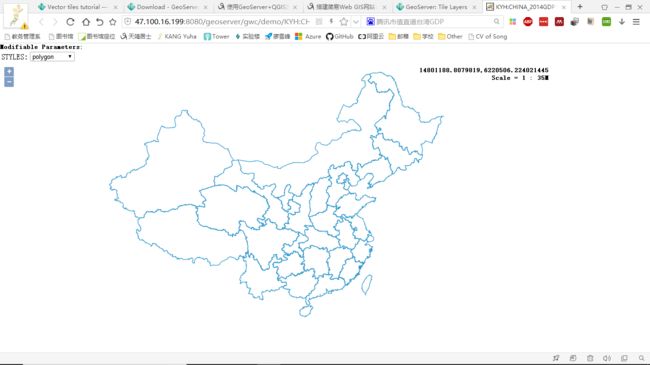
为了验证插件是否安装成功,选择任意一个图层,查看Tile Caching.如果图中出现以下选项则说明插件安装成功。
在Tile Layers中选择相应的图层,再选择相应的格式,例如:EPSG:900913,就可以查看了。
调用Vector Tile服务
调用Vector Tile服务可以参考官方文档:Vector Tiles Tutorial
这里使用了Mapbox的矢量切片格式。将其中的服务url改成自己的即可。代码如下:
  var layer = 'opengeo:countries';
  var projection_epsg_no = '900913';
  var map = new ol.Map({
    target: 'map',
    view: new ol.View({
      center: [0, 0],
      zoom: 2
    }),
    layers: [new ol.layer.VectorTile({
      style:simpleStyle,
      source: new ol.source.VectorTile({
        tilePixelRatio: 1, // oversampling when > 1
        tileGrid: ol.tilegrid.createXYZ({maxZoom: 19}),
        format: new ol.format.MVT(),
        url: '/geoserver/gwc/service/tms/1.0.0/' + layer +
            '@EPSG%3A'+projection_epsg_no+'@pbf/{z}/{x}/{-y}.pbf'
      })
    })]
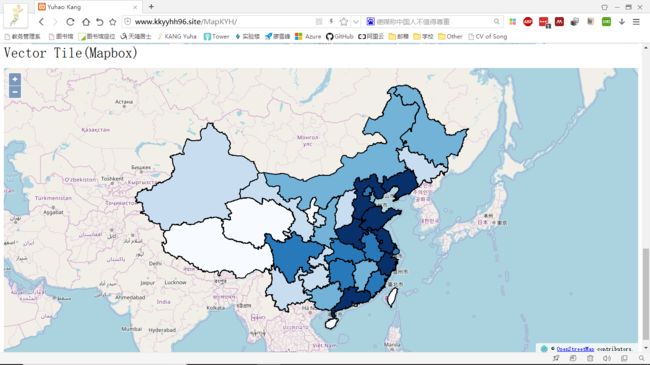
需要注意的是,与先前的发布不同,矢量切片服务发布之后是没有样式的。对于样式,需要在前端使用OpenLayers写相应的style,从而完成渲染。在这个案例中,只能使用EPSG:900913投影,如果需要修改投影,也同时需要修改tileGrid的相关参数。
PS:调用矢量切片可能会出现No 'Access-Control-Allow-Origin' header is present on the requested resource.报错的情况,解决方法参见:解决Tomcat No 'Access-Control-Allow-Origin' header is present on the requested resource错误信息
最终效果如下图:
所有的代码请参见github: https://github.com/kkyyhh96/WebGIS
其中OpenLayers文件夹下的index.html文件。
或直接访问: www.kkyyhh96.site/MapKYH
1.搭建简易Web GIS网站:使用GeoServer+PostgreSQL+PostGIS+OpenLayers3
2.使用GeoServer+QGIS发布WMTS服务
3.使用GeoServer+OpenLayers发布和调用WMTS、Vector Tile矢量切片服务 .
4.Leaflet入门:添加点线面并导入GeoJSON数据