全国地铁城市数据分析(python实现)
全国地铁城市数据分析(数据清洗+可视化分析)
一确定问题:
由题看出其属于开放问题,没有明确的目的(即可认为无题),其重点是让人发现问题(比如过程中分析时发现数据有哪些实在的问题就可以拿出来单独分析),了解数据处理,数据可视化
但是可以通过该问题比较系统的了解数据分析的过程(实际上这里重点是数据分析中的评估部分)
1.获取数据-采用爬虫访问百度地铁地图获取数据的方法
request+xpath爬虫:
- 得到url-http://map.amap.com/subway/index.html?&1100
- 发出请求得到响应对象-request模块
- 获取响应对象数据-使用text函数直接获取网页文本。有些数据为json字符串的形式,需要用到json转化
- 解析数据-使用xpath
- 持久化存储-在数据分析中一般将数据保存为csv格式,跟利于处理
在过程中使用了time模块-sleep函数防止网站宕机
主要的3个函数
#3个函数
headers = {
    'user-agent': 'Mozilla/5.0 (Windows NT 10.0; WOW64) AppleWebKit/537.36 (KHTML, like Gecko) Chrome/69.0.3947.100 Safari/537.36 2345Explorer/10.11.0.20694'}


def get_city():#用于得到城市ID和城市名称
    url = 'http://map.amap.com/subway/index.html?&1100'
    time.sleep(2)
    res = requests.get(url=url, headers=headers)
    res.raise_for_status()
    res.encoding = res.apparent_encoding
    html = res.text
    Html = etree.HTML(html)
    # 城市列表
    res1 = Html.xpath('/html/body/div[1]/div[1]/div[1]/div[2]/div[1]/a')
    res2 = Html.xpath('/html/body/div[1]/div[1]/div[1]/div[2]/div[2]/div[2]/a')
    for i in res1:
        # 城市ID值
        ID = ''.join(i.xpath('.//@id'))  # 属性需要加上双斜杠
        # 城市拼音名
        cityname = ''.join(i.xpath('.//@cityname'))  # ./表示在当层目录下使用
        # 城市名
        name = ''.join(i.xpath('./text()'))
        get_message(ID, cityname, name)
        city_ID.update({name: ID})

    for i in res2:
        # 城市ID值
        ID = ''.join(i.xpath('.//@id'))
        # 城市拼音名
        cityname = ''.join(i.xpath('.//@cityname'))
        # 城市名
        name = ''.join(i.xpath('./text()'))
        # print(cityname)
        get_message(ID, cityname, name)

city_ID = {}

def get_message(ID, cityname, name):#用于得到城市的具体线路信息
    """
    地铁线路信息获取
    """
    url = 'http://map.amap.com/service/subway?_1555502190153&srhdata=' + ID + '_drw_' + cityname + '.json'
    # global end_list
    global stations
    # if end_list.get(cityname) == None:
    #     end_list[cityname] = []
    # end_list[cityname].setdefault([])
    response = requests.get(url=url, headers=headers)
    time.sleep(2)
    html = response.text
    # print(html)
    result = json.loads(html)
    for i in result['l']:
        for j in i['st']:
            # 判断是否含有地铁分线
            if len(i['la']) > 0:
                # print(name,cityname,j['sl'],j['poiid'], i['ln'] + '(' + i['la'] + ')', j['n'])
                with open('subway.csv', 'a+', encoding='utf-8') as f:
                    f.write(name + ',' + cityname + ',' + j['poiid'] + ',' + j['sl'] + ',' + i['ln'] + '(' + i[
                        'la'] + ')' + ',' + j['n'] + '\n')
                    f.close()
            else:
                # print(name,cityname,j['sl'],j['poiid'], i['ln'], j['n'])
                with open('subway.csv', 'a+', encoding='utf-8')as f:
                    f.write(
                        name + ',' + cityname + ',' + j['poiid'] + ',' + j['sl'] + ',' + i['ln'] + ',' + j['n'] + '\n')
                    f.close()
            # end_list[cityname].append(j['n'])
    print(name + '地铁站点爬取结束')
    f.close()

def get_district(df_data):#用于得到每个地铁站点的行政区
    url1 = 'https://www.youbianku.com/SearchResults?address='
    # response=requests.get(url=url1,headers=headers)
    # response.enconding='utf-8'
    # print(response.text)
    from selenium.webdriver.common.desired_capabilities import DesiredCapabilities
    chrome_options = webdriver.ChromeOptions()
    desired_capabilities = DesiredCapabilities.CHROME
    desired_capabilities["pageLoadStrategy"] = "none"
    chrome_options.add_argument('--headless')
    chrome_options.add_argument('--disable-gpu')
    driver = webdriver.Chrome(options=chrome_options,
                              executable_path=r'C:\Users\Dcnightmare\Desktop\chromedriver')
    list_city=[]
    last_text=''
    # driver.get(url='https://www.youbianku.com')
    for i in list(zip(df_data['站点城市'].values, df_data['地铁站点名称'])):
        driver.get(url=url1 + ''.join(list(i)))
        # driver.find_element_by_id('mySearchInput').send_keys(''.join(list(i)))
        # driver.find_element_by_id('mySearchButton').click()
        html_from_page = driver.page_source
        html = etree.HTML(html_from_page)
        try:
            text = html.xpath('//div[@class="mw-parser-output"]/div[1]//table//tr[2]/td/text()')[0]
            text = text.split('市')[1].split('区')[0] + '区'
        except Exception:
            driver.execute_script("window.stop()")
            list_city.append(last_text)
            continue
        if text=='区':
            list_city.append(last_text)
            continue
        last_text=text
        list_city.append(last_text)
    df_data['行政区']=list_city
2.有了初步数据之后,需要进一步将数据变为我们可以使用的数据
- 缺失值处理
- (标准化,归一化,离散化…)这里没有使用因为这些数据处理都是用于分类,回归等任务中,而本文主要是对地铁站数据的简单分析
- 重复项处理
    import pandas as pd
    df_data = pd.read_csv('subway.csv', sep=',')  # 使用pd的好处可以使用行和列名进行数据访问
    print(df_data)
    # 缺失值处理:
    # 得到其读取到的行
    print('删除之前的行:',df_data.shape)
    # 得到所有的属性非空项
    print(df_data.info())
    # 得出其中没有缺失值的行
    # 重复数据处理
    # """删除完全重复的站点"""
    df_data_1 = df_data.drop_duplicates()  # 删除掉完全相同的行
    # 得到删除之后的行
    print('删除之后的行:',df_data_1.shape)
这得到的数据真的就是最终数据集了吗?
其实不然,如果仔细观察可以发现其中有很多的站点存在重复(即一个站可能是多条地铁线路站点的情况),所以在考虑求一个城市总的站点数量时还需要去除其中的重复站点数量。
	number_sum=0#统计总的站点数量
    num_station_check = {}  # 用于检查多余情况
    num_station_old = {}#统计处理前的各城市站点数量
    num_station_new = {}  # 得到站点城市的地铁站点实际数量
    for p in zip(df_data_3['站点城市'], df_data_3['地铁站点名称']):
        (i, j) = p
        # 原始数据
        if num_station_old.get(i) == None:
            num_station_old[i] = 1
        else:
            num_station_old[i] += 1
        # 处理后的数据
        if num_station_check.get(p) == None:
            number_sum+=1
            if num_station_new.get(i) == None:
                num_station_new[i] = 1
            else:
                num_station_new[i] += 1
            num_station_check[p] = 1
到此数据集的准备工作就差不多了.
让我们来试试做最有意思的部分吧!
3.数据分析+可视化
每个人开始分析的入手角度不同,所以看个人
- 分析各个城市的站点数量,因为他是最直观的数据
- 分析城市的地铁站点在全国分布情况
- 分析各城市地铁站点在全国站点中的比率
- 分析各个城市的具体数据(内部行政区/市)
出于比较所以我还找了2020年的地铁站点数据,如果有兴趣也可这样做,不过很可能有错误项,比如2020某城市地铁数据量反而比2021年的高,不过找到这种情况之后可以通过自己再查新闻是否如此(还是挺有趣的)
这里主要通过的是pyecharts来进行的图表绘制,因为其数据可视化效果比较好,maltplotlib我用着不好使
一.分析各个城市的站点数量
		from pyecharts.charts import Bar
        from pyecharts import options as opts
        from pyecharts.charts import Line
        import pandas as pd

        attr = list(num_station_new.keys())
        v1 = list(num_station_new.values())#新2021站点数据,主要体现数据处理
        v2 = list(num_station_old.values())#旧2021站点数据
        v1_v2 = []  # 用于得到换乘站点占比,  主要体现数据分析
        # 解释:换乘占比越大其地铁线路越是密集,其地铁相对城市的规模也比较大,因为前期地铁是以向外拓宽为核心,一般都会尽量避免出现换乘站点,导致其资源浪费
        # 当然也不是绝对的,可能有所偏差,但是大方向是对的
        for i in range(0, len(v1)):
            v1_v2.append(round((v2[i] - v1[i]) / v1[i], 3))  # round用于保留数据的位数
        # print(('%.2f' %12.234456))#使用两个%也可以达到格式化数据的目的

        bar1 = (
            Bar(init_opts=opts.InitOpts(width="1700px", height="800px"))  # 注意添加默认参数时是在init_opts参数中设置
                .add_xaxis(attr)
                .add_yaxis('station_number_2021_new', v1, itemstyle_opts=opts.ItemStyleOpts(color='blue'),
                           label_opts=opts.LabelOpts(is_show=True, position='top', formatter="{c}",
                                                     color='black'))  # 显示数据标签
                .add_yaxis('station_number_2021_old', v2, itemstyle_opts=opts.ItemStyleOpts(color='green'),
                           label_opts=opts.LabelOpts(is_show=True, position='top', formatter="{c}",
                                                     color='blue'))  # 显示数据标签
                .add_yaxis('换乘站点占比', v1_v2, itemstyle_opts=opts.ItemStyleOpts(color='orange'),
                           label_opts=opts.LabelOpts(is_show=True, position='top', formatter="{c}",
                                                     color='green'))  # 显示数据标签
                .extend_axis(  # 设置次坐标轴
                yaxis=opts.AxisOpts(
                    name="换乘站点占比率",  # 次坐标轴名称
                    type_="value",  # 次坐标手类型
                    min_=0,  # 最小值
                    max_=50,  # 最大值
                    is_show=True,  # 是否显示
                    axisline_opts=opts.AxisLineOpts(is_show=False,  # y轴线不显示
                                                    linestyle_opts=opts.LineStyleOpts(color='#f6c065')),  # 设置线颜色, 字体颜色也变
                    axistick_opts=opts.AxisTickOpts(is_show=False),  # 刻度线不显示
                    axislabel_opts=opts.LabelOpts(formatter="{value}%"),  # 次坐标轴数据显示格式
                )
            )

                .set_global_opts(  # 对x轴标签,y轴,标题,图例的格式和类型进行修改
                # 图例默认放到 上中 位置
                xaxis_opts=opts.AxisOpts(
                    name='城市',
                    name_location='middle',
                    name_gap=30,  # 与x轴线的距离
                    # name_Rorate设置旋转角度

                    #                 x轴名称的格式配置
                    name_textstyle_opts=opts.TextStyleOpts(
                        font_family='Microsoft Yahei',
                        font_size=20,
                    ),
                    #                 坐标轴刻度配置项
                    axistick_opts=opts.AxisTickOpts(
                        is_show=True,
                        #                     is_show=False,  # 是否显示
                        is_inside=True,  # 刻度线是否在内侧
                    ),
                    #                 坐标轴线的配置
                    axisline_opts=opts.AxisLineOpts(
                        linestyle_opts=opts.LineStyleOpts(
                            width=1,
                            color='black',
                        )
                    ),
                    axislabel_opts=opts.LabelOpts(
                        rotate=40,
                        font_size=12,
                        font_family='Arial',
                        font_weight='bold'
                    ),

                ),
                yaxis_opts=opts.AxisOpts(
                    name='station_number',
                    name_location='middle',
                    name_gap=30,
                    name_textstyle_opts=opts.TextStyleOpts(
                        font_family='Times New Roman',
                        font_size=20,
                        color='black',
                        #                     font_weight='bolder',
                    ),
                    axistick_opts=opts.AxisTickOpts(

                        is_show=False,  # 是否显示

                        is_inside=True,  # 刻度线是否在内侧
                    ),
                    axislabel_opts=opts.LabelOpts(
                        font_size=12,
                        font_family='Times New Roman',
                        formatter="{value}"  # y轴显示方式以数据形式
                    ),
                    splitline_opts=opts.SplitLineOpts(is_show=True),  # y轴网格线
                    axisline_opts=opts.AxisLineOpts(is_show=False),  # y轴线
                ),
                title_opts=opts.TitleOpts(
                    title="城市地铁站点数量",  # 标题
                    title_textstyle_opts=opts.TextStyleOpts(font_size=20),  # 主标题字体大小
                    subtitle="hello_data_analysis",  # 副标题
                pos_left='6%'),
            toolbox_opts=opts.ToolboxOpts(is_show=True),
        )
    )
    bar1.render('bar_2021_and_2020.html')  # 将其输出为html文件
    #使用webbrowser模块直接打开网页
    import webbrowser
    webbrowser.open('bar_2021_and_2020.html')
    print("直方图分析结束!")
解释这里的一个数据-换乘站点占比,由其地铁站点实际分布的地图,我初步认为,在城市建立地铁的初期都是在扩大其覆盖区域,把居民区(郊区)和商业区(市中心)以及火车站、机场尽可能与客流量挂钩的地方等连接起来,很少会出现站点重合的现象导致其换乘点占比就比较小,所以如果换乘站点占比大,可以粗略估计其地铁的发展比较好,规模相对该城市规模而言也比较大,侧面反映了当地的经济发展水平比较高.当然还存在一些其他情况比如说考虑到地质结构,太容易塌陷的地方或者地震断裂带也是不行的.
来看结果:
_第1张图片](http://img.e-com-net.com/image/info8/fb13117a9c404378b9865accc505326e.jpg)
换乘站点占比:
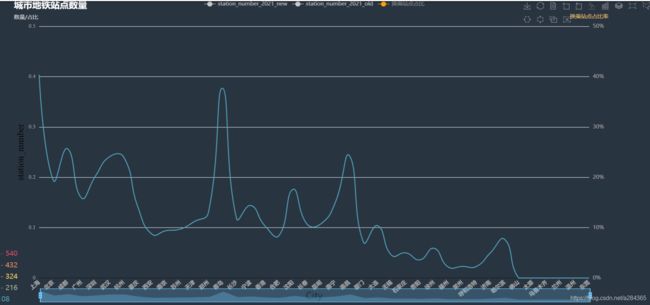
从图中我们可以看到上海的换乘站点占比最高 ,然后查阅相关新闻时也发现上海的地铁发展确实是在大陆地铁发展排名靠前的,2020年其总行驶里程也是全国范围内最高的.不过其中有两个城市存在偏差,就是青岛和南昌,导致这个问题出现的原因,我推测像是在数量规模不大的时候其换乘站点占比就很高,很可能是因为当地的发展不平衡导致的.为验证结论先分析了青岛各个区的地铁数据和地铁线路
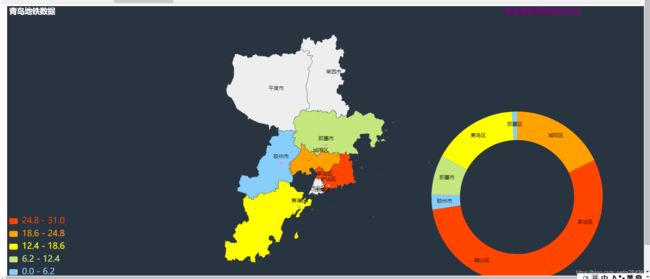

我们发现都是在沿海位置,通过后面的地图分析,其实就可以发现他的主要客流来源都比较集中,并且其城市并不太大导致其地铁链路主要集中在这些客流量大的地方,所以其换乘占比比较高
南昌类似也是这种情况
二.分析城市的地铁站点在全国分布情况
这里要说明的是:
因为绘制中国地图时需要其经纬度数据,而我们只有每个站点的经纬度数据,所以需要再从网站找到这些站点城市的经纬度数据
这里我们再次使用爬虫
url->https://www.d1xz.net/xp/jingwei/
#ur伪装
ity_provice={}#城市的provice
provice_city={}#provice中的城市
stations = []
headers = {
    'user-agent': 'Mozilla/5.0 (Windows NT 10.0; WOW64) AppleWebKit/537.36 (KHTML, like Gecko) Chrome/69.0.3947.100 Safari/537.36 2345Explorer/10.11.0.20694'}
#
jinwei = {}  # 用于存放各大城市的主要经纬度

def get_jinwei(station_city):
    url = 'https://www.d1xz.net/xp/jingwei/'
    time.sleep(1)
    ans = requests.get(url=url, headers=headers)
    end = ans.text
    Html = etree.HTML(end)
    res = Html.xpath('//div[@class="inner_con_art"]/table//tr')
    for i in range(1, 5):
        res = Html.xpath('//div[@class="inner_con_art"]/table//tr[' + str(i) + ']/td')
        for j in res:
            res_end = j.xpath('./strong/a/@href')  # 紧接着之前的对象继续进行xpath操作
            # print(res_end)
            if len(res_end) != 0:
                name = j.xpath('./strong/a/text()')[0]
                url_end = 'https://www.d1xz.net/' + res_end[0]
                ans_1 = requests.get(url=url_end, headers=headers)
                end_1 = ans_1.text
                Html_1 = etree.HTML(end_1)
                res_1 = Html_1.xpath('//div[@class="inner_con_art"]/table//tr')
                for num_ in range(2, len(res_1)):
                    end_end = Html_1.xpath('//div[@class="inner_con_art"]/table//tr[' + str(num_) + ']/td/text()')
                    if end_end[0] in station_city:
                        provice_city.setdefault(name,[]).append(end_end[0])
                        city_provice.update({end_end[0]:name})
                    jinwei.update({end_end[0]: [end_end[1], end_end[2]]})
    city_provice.update({'香港':'香港'})
    provice_city.update({'香港':['香港']})
    jinwei.update({'香港': ['114.12', '22.26']})
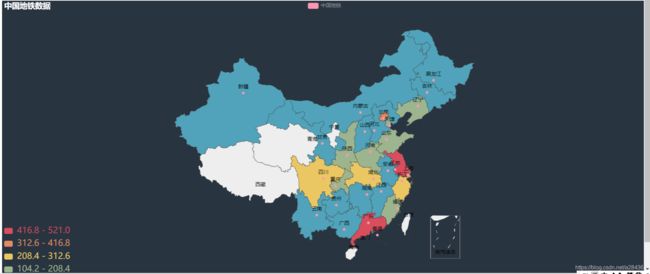
得到各城市的经纬度数据之后就可以绘制地图了
#全国地图
	from pyecharts import options as opts
    from pyecharts.globals import ChartType
    data_yy=list(num_station_new.values())
    data_xx=list(num_station_new.keys())
    get_jinwei(data_xx)
    data=num_station_new
    provice={}
    for i in data_xx:
        provice.setdefault(city_provice[i],0)
        provice[city_provice[i]]+=data[i]
    from pyecharts import options as opts
    from pyecharts.charts import Map
    china_map = (
        Map(init_opts=opts.InitOpts(width="1530px", height="684px",theme=ThemeType.CHALK))
            .add("中国地铁", [list(z) for z in provice.items()], "china")
            .set_global_opts(
            title_opts=opts.TitleOpts(title="中国地铁数据"),
            visualmap_opts=opts.VisualMapOpts(max_=max(provice.values()), is_piecewise=True,textstyle_opts=opts.TextStyleOpts(color='write',font_size=20,font_family='Microsoft YaHei')),
        )
    )

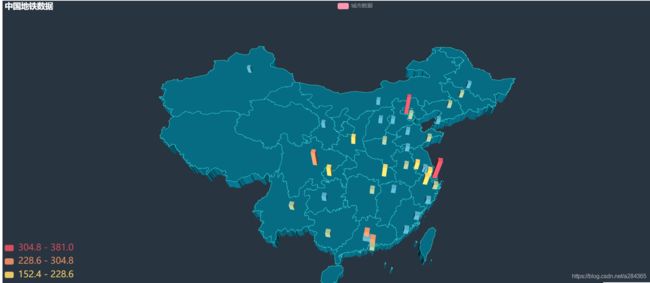
    #地铁在各大城市的分布情况(从中国地图来看 3D)
    from pyecharts import options as opts
    from pyecharts.charts import Map3D
    from pyecharts.globals import ChartType
    from pyecharts.commons.utils import JsCode
    for i in num_station_new:
        jinwei[i].append(num_station_new[i])#添加城市的站点数量,也相当于加上高度
    example_data = [
        (p,jinwei[p]) for p in num_station_new.keys()]
    c = (
        Map3D(init_opts=opts.InitOpts(width="1500px", height="700px"))
            .add_schema(
            itemstyle_opts=opts.ItemStyleOpts(
                color="rgb(5,101,123)",
                opacity=1,
                border_width=0.8,
                border_color="rgb(62,215,213)",
            ),
            map3d_label=opts.Map3DLabelOpts(
                is_show=False,
                formatter=JsCode("function(data){return data.name + " " + data.value[2];}"),
            ),
            emphasis_label_opts=opts.LabelOpts(
                is_show=False,
                color="#fff",
                font_size=10,
                    background_color="rgba(0,23,11,0)",
            ),
            light_opts=opts.Map3DLightOpts(
                main_color="#fff",
                main_intensity=1.2,
                main_shadow_quality="high",
                is_main_shadow=False,
                main_beta=10,
                ambient_intensity=0.3,
            ),
        )
            .add(
            series_name="数据",
            data_pair=example_data,
            type_=ChartType.BAR3D,
            bar_size=1,
            shading="lambert",
            label_opts=opts.LabelOpts(
                is_show=False,
                formatter=JsCode("function(data){return data.name + ' ' + data.value[2];}"),
            ),
        )
            .set_global_opts(title_opts=opts.TitleOpts(title="城市数据"))
            .render("带有数据展示地图.html")
    )
    import webbrowser
    webbrowser.open('带有数据展示地图.html')
    print("地铁城市在中国分布分析结束!")
可以看出地铁城市的分布主要是一些沿海城市,而我们也知道沿海城市的经济发展相对其他城市要高出一截,也因为经济发展好,其流动人数也比较多.
查找原因后 发现实际上不是城市想修地铁就可以修的,需要有高经济支持(一般都是GDP达到…才行)和人口数量的要求.
三.分析各城市地铁站点在全国站点中的比率
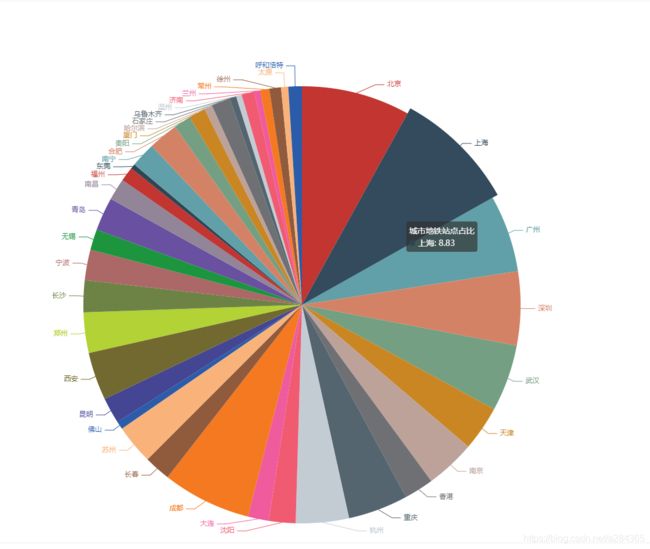
如果数量不好直接比较的话,那么通过数据所占百分比就可以较好的实现比较各个城市地铁站点数量
 station_proportion=[]
    for i in num_station_new.values():
        station_proportion.append(("%.2f" %(i/number_sum*100)))
    from pyecharts.charts import Pie
    import pyecharts.options as opts
    data_pie=tuple(zip(num_station_new.keys(),station_proportion))
    # print(data_pie)
    pie=(
        Pie(init_opts=opts.InitOpts(width="1600px", height="1000px"))
        .add(series_name='城市地铁站点占比',data_pair=data_pie,center=[600,600],label_opts=opts.LabelOpts(distance=30,is_show=True)
             ,tooltip_opts=opts.TooltipOpts(is_show=True),radius=None
             # ,rosetype='radius'
             # ,rosetype='area'
             )
    )
    pie.render('station_number_pie.html')
    import webbrowser
    webbrowser.open('station_number_pie.html')
    print('站点数据饼状图展示结束!')
结果如下:
四.分析各个城市的具体数据(内部行政区/市)
主要通过前面的3d中国地铁地图中的动态数据标签进行选择,借助selenium实现对页面动态数据的爬取,由爬取到的数据通过判断是否为含有多个地铁市的省中,如果是则通过弹出的窗口选择省地图还是市地图
主要就是show_city函数
from pyecharts.charts import BMap
from pyecharts.globals import BMapType, ChartType
js = "window.open('{}','_blank');"
def show_city(bro,city):#city使用字典型
from pyecharts.globals import SymbolType, ThemeType
from pyecharts import options as opts
global num_station_new,jinwei,num_city_new,df_data_3
station = [] # 每条路线初始化为空
stations = [] # 城市初始化为空
center_x=0
center_y=0
station_point=[]
for i in city[1]:
data_ = df_data_3[df_data_3.站点城市 == i].values # 开始先对每条线路排了序
center_x+=float(jinwei[i][0])
center_y+=float(jinwei[i][1])
for num, j in enumerate(data_): # columns属性得到的迭代对象是列属性名 类似于字典中的keys,indexs得到的是行属性名一般是序号
station.append([j[4], j[5], j[6]])
station_point.append([j[4], j[5], j[6]])
if num == len(data_) - 1 or data_[num + 1][6] != data_[num][6]:
stations.append(station)
station = []
center_x/=len(city[1])
center_y/=len(city[1])
if len(city[1])!=1:
Zoom=8
else:
Zoom=10
map_b = ( # 不要异想天开认为可以将其拆开 然后每一条线赋值从而达到可以使用不同颜色添加不同的类型图的目的
BMap(init_opts=opts.InitOpts(width="1500px", height="800px",theme=ThemeType.MACARONS))
.add_schema(
baidu_ak='ybGicIBt9c56brfI4alusbE8SfclQcjW', # 百度地图开发应用appkey
center=[center_x,center_y], # 当前视角的中心点
zoom=Zoom, # 当前视角的缩放比例
is_roam=True, # 开启鼠标缩放和平移漫游
)
.add(
series_name=city[0]+'地铁',
type_=ChartType.LINES, # 设置Geo图类型,(pyecharts库中负责地理坐标系的模块是Geo)
# 如果是默认的 则为点型有参数symbol_size用于设置点的大小
# data_pair=stations, # 数据i项
data_pair=stations,
is_polyline=True, # 是否是多段线,在画lines图情况下#
linestyle_opts=opts.LineStyleOpts(color="blue", opacity=0.5, width=1.5), # 线样式配置项
effect_opts=opts.EffectOpts(
symbol=SymbolType.ROUND_RECT, symbol_size=3, color="red"
)
)
.set_global_opts(title_opts=opts.TitleOpts(title=city[0]+"的地铁线路"),
tooltip_opts=opts.TooltipOpts(is_show=True))
.add_control_panel(
maptype_control_opts=opts.BMapTypeControlOpts(type_=BMapType.MAPTYPE_CONTROL_HORIZONTAL), # 切换地图类型的控件
scale_control_opts=opts.BMapScaleControlOpts(), # 比例尺控件
overview_map_opts=opts.BMapOverviewMapControlOpts(is_open=True), # 添加缩略地图
navigation_control_opts=opts.BMapNavigationControlOpts() # 地图的平移缩放控件
)
# .add_coordinate_json(json_file='json.json')
.set_series_opts(effect_opts=opts.EffectOpts(is_show=True, color='red'))
.render(city[0]+'地铁线路图.html')
)
# print('ok1')
# # map_b.render(city[0]+'.html')
# # bro.execute_script(js.format(city[0]+'.html'))
data_yy = list(num_station_new.values())
data = num_station_new
station_sum = 0
df_x=[]
df_y=[]
from collections import Counter
for i in city[1]:
station_sum += data[i]
count = dict(Counter(num_city_new[i]))
df_x+=list(count.keys())
df_y+=list(count.values())
data_xy=tuple(zip(df_x,df_y))
data_xy=sorted(data_xy,key=lambda x:x[1],reverse=True)
data_xy=dict(data_xy)
from pyecharts import options as opts
from pyecharts.charts import Map
#每个城市单独的分布地图
if len(city[1])!=1:
df_city_x=[i+'市' for i in city[1]]
df_city_y = [num_station_new[i] for i in city[1]]
show_city = (
Map(init_opts=opts.InitOpts(width="1700px", height="760px",theme=ThemeType.CHALK))
.add(city[0], [list(z) for z in zip(df_city_x,df_city_y)],maptype=city[0])
.set_global_opts(
title_opts=opts.TitleOpts(title=city[0]+"地铁数据",title_textstyle_opts=opts.TextStyleOpts(font_size=20)),
visualmap_opts=opts.VisualMapOpts(max_=max(df_city_y),is_piecewise=True,range_color=["lightskyblue", "yellow", "orangered"], range_text=["High", "Low"],textstyle_opts=opts.TextStyleOpts(color='write', font_size=20,
font_family='Microsoft YaHei'))
,legend_opts=opts.LegendOpts(is_show=False)
)
)
show_pie=(
Pie(init_opts=opts.InitOpts(width="200px", height="200px",theme=ThemeType.DARK))
.add(
city[0]+"各城市地铁占比",
data_pair=[list(i) for i in zip(df_city_x,df_city_y)],
radius=["20%", "30%"],
center=[1200, 450],
label_opts=opts.LabelOpts(
position="outside",
formatter="{a|{a}}{abg|}\n{hr|}\n {b|{b}: }{c} {per|{d}%} ",
background_color="#eee",
border_color="#aaa",
border_width=1,
border_radius=4,
rich={
"a": {"color": "#999", "lineHeight": 22, "align": "center"},
"abg": {
"backgroundColor": "#e3e3e3",
"width": "100%",
"align": "right",
"height": 22,
"borderRadius": [4, 4, 0, 0],
},
"hr": {
"borderColor": "blue",
"width": "100%",
"borderWidth": 0.5,
"height": 0,
},
"b": {"fontSize": 16, "lineHeight": 33},
"per": {
"color": "#eee",
"backgroundColor": "#334455",
"padding": [2, 4],
"borderRadius": 2,
},
},
),
)
.set_global_opts(legend_opts=opts.LegendOpts(is_show=True))
)
else:
show_city = (
Map(init_opts=opts.InitOpts(width="1700px", height="760px", theme=ThemeType.DARK))
.add(city[0], [list(z) for z in zip(df_x, df_y)], maptype=city[0])
.set_global_opts(
title_opts=opts.TitleOpts(title=city[0]+"地铁数据"),
visualmap_opts=opts.VisualMapOpts(max_=max(df_y), is_piecewise=True,range_color=["lightskyblue", "yellow", "orangered"], range_text=["High", "Low"],
textstyle_opts=opts.TextStyleOpts(color='write', font_size=20,
font_family='Microsoft YaHei'))
, legend_opts=opts.LegendOpts(is_show=False)
)
)
data_pie_y=[round(i / sum(df_y)*100, 2) for i in df_y]
show_pie = (
Pie(init_opts=opts.InitOpts(width="1530px", height="684px",theme=ThemeType.CHALK))
.add(
city[0] + "各区地铁占比",
data_pair=[list(i) for i in zip(df_x, df_y)],
radius=["40%", "60%"],
center=[1200, 450],
label_opts=opts.LabelOpts(
is_show=True, position="inside",color='black'
),
)
.set_global_opts(legend_opts=opts.LegendOpts(is_show=False),title_opts=opts.TitleOpts(title=city[0]+"各区地铁站点占比",pos_top='top',pos_right='10%',title_textstyle_opts=opts.TextStyleOpts(color='purple')))
.set_series_opts(
tooltip_opts=opts.TooltipOpts(
trigger="item", formatter="{a}
{b}: {c} ({d}%)"
),
# label_opts=opts.LabelOpts(formatter="{b}: {c}")
)
)
from pyecharts import options as opts
from pyecharts.charts import Liquid
from pyecharts.commons.utils import JsCode
liquid = (
Liquid(init_opts=opts.InitOpts(width="200px", height="200px",theme=ThemeType.CHALK))
.add(city[0]+'占比',[round(station_sum/sum(data_yy),4),1-round(station_sum/sum(data_yy),4)],center=[1200,450],shape=SymbolType.ARROW,label_opts=opts.LabelOpts(
font_size=40,
formatter=JsCode(
"""function (param) {
return (Math.floor(param.value * 10000) / 100) + '%';
}"""
),
position="inside",
),
)
.set_global_opts(title_opts=opts.TitleOpts(title=city[0]+"地铁站点在全国占比",pos_top='top',pos_right='10%',title_textstyle_opts=opts.TextStyleOpts(color='purple')))
)
from pyecharts import options as opts
from pyecharts.charts import Funnel
if len(df_y) > 15:
copy_y = list(data_xy.values())[:15]
copy_x = list(data_xy.keys())[:15]
else:
copy_y = list(data_xy.values())
copy_x = list(data_xy.keys())
loudou = (
Funnel(init_opts=opts.InitOpts(width="1530px", height="684px", theme=ThemeType.CHALK))
.add(
city[0] + "地铁",
[list(z) for z in zip(copy_x, copy_y)],
label_opts=opts.LabelOpts(position="inside"),
)
.set_global_opts(legend_opts=opts.LegendOpts(is_show=True),
visualmap_opts=opts.VisualMapOpts(is_show=True, type_='color', max_=max(df_y),is_piecewise=True,textstyle_opts=opts.TextStyleOpts(color='write',font_size=15,font_family='Microsoft YaHei')),
title_opts=opts.TitleOpts(title=city[0]+'地铁分析',title_textstyle_opts=opts.TextStyleOpts(font_size=20)))
)
from pyecharts.charts import Bar
show_bar=(
Bar(init_opts=opts.InitOpts(width="1700px", height="760px", theme=ThemeType.CHALK)) # 注意添加默认参数时是在init_opts参数中设置
.add_xaxis(copy_x)
.add_yaxis('2021'+city[0]+'地铁分布', copy_y, itemstyle_opts=opts.ItemStyleOpts(color='blue'),
label_opts=opts.LabelOpts(is_show=True, position='top', formatter="{c}",
color='Magenta4')) # 显示数据标签
.set_global_opts( # 对x轴标签,y轴,标题,图例的格式和类型进行修改
# datazoom_opts=opts.DataZoomOpts(is_show=True),
visualmap_opts=opts.VisualMapOpts(is_show=True, type_='color', max_=max(df_y),is_piecewise=True,textstyle_opts=opts.TextStyleOpts(color='write',font_size=15,font_family='Microsoft YaHei')),
xaxis_opts=opts.AxisOpts(
name='City',
name_location='middle',
name_gap=30, # 与x轴线的距离
# name_Rorate设置旋转角度
# x轴名称的格式配置
name_textstyle_opts=opts.TextStyleOpts(
font_family='Microsoft Yahei',
font_size=20,
),
# 坐标轴刻度配置项
axistick_opts=opts.AxisTickOpts(
is_show=True,
# is_show=False, # 是否显示
is_inside=True, # 刻度线是否在内侧
),
# 坐标轴线的配置
axisline_opts=opts.AxisLineOpts(
linestyle_opts=opts.LineStyleOpts(
width=1,
color='black',
)
),
axislabel_opts=opts.LabelOpts(
rotate=40,
font_size=12,
font_family='Arial',
font_weight='bold'
),
),
yaxis_opts=opts.AxisOpts(
name='station_number',
name_location='middle',
name_gap=30,
name_textstyle_opts=opts.TextStyleOpts(
font_family='Times New Roman',
font_size=20,
color='black',
# font_weight='bolder',
),
axistick_opts=opts.AxisTickOpts(
is_show=False, # 是否显示
is_inside=True, # 刻度线是否在内侧
),
axislabel_opts=opts.LabelOpts(
font_size=12,
font_family='Times New Roman',
formatter="{value}" # y轴显示方式以数据形式
),
splitline_opts=opts.SplitLineOpts(is_show=True), # y轴网格线
axisline_opts=opts.AxisLineOpts(is_show=False), # y轴线
),
title_opts=opts.TitleOpts(
title=city[0]+"地铁站点数量", # 标题
title_textstyle_opts=opts.TextStyleOpts(font_size=20), # 主标题字体大小
),
)
)
from pyecharts.charts import Grid
from pyecharts.globals import SymbolType, ThemeType
grid1 = (
Grid(init_opts=opts.InitOpts(width="1530px", height="684px", theme=ThemeType.CHALK))
.add(show_city, grid_opts=opts.GridOpts(pos_bottom='50%', pos_right='left'))
.add(show_pie, grid_opts=opts.GridOpts(pos_bottom='50%', pos_left='55%'))
# .add(liquid, grid_opts=opts.GridOpts(pos_top='60%', pos_right='50%',width='100px',height='100px'))
)
grid2=(
Grid(init_opts=opts.InitOpts(width="1530px", height="684px", theme=ThemeType.CHALK))
.add(show_bar, grid_opts=opts.GridOpts(pos_right='55%'))
# .add(loudou,grid_opts=opts.GridOpts(pos_left='80%'))
.add(liquid,grid_opts=opts.GridOpts())
)
# print('ok5')
from pyecharts.charts import Tab
show_tab=(
Tab()
.add(grid2, city[0]+'地铁数量情况')
.add(loudou,city[0]+'地铁(<=15)')
.add(grid1, city[0]+'地铁分布情况')
)
show_tab.render(city[0] + '.html')
bro.execute_script(js.format(city[0] + '.html'))
bro.execute_script(js.format(city[0]+'地铁线路图' + '.html'))
bro.switch_to.window(bro.window_handles[0])
结果如下:
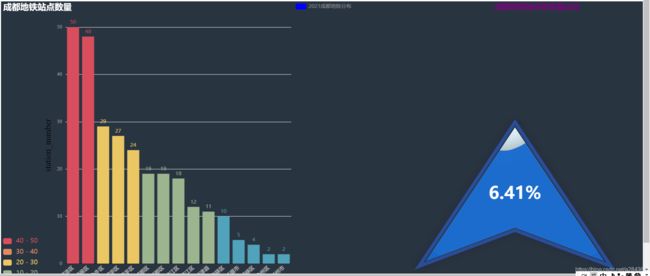
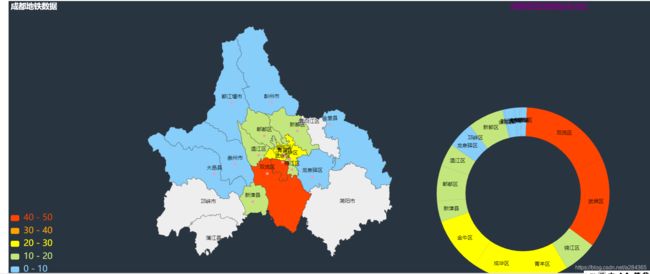
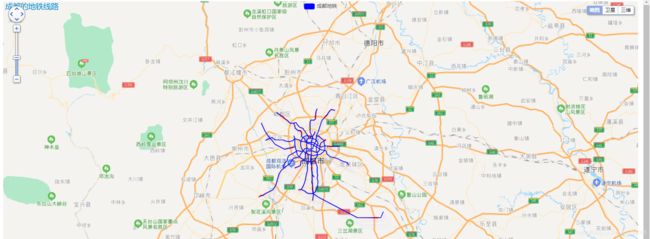
成都市数据

江苏省的数据:(其他省同理)


主要还是说明了其地铁规模和分布情况
4.总结:
本次项目实际的分析比较少,主要是站点和其城市的分析,比较表层,没有深入。比如数据集其实可以加入不同年份的数据进行比较,或者加入不同城市的地铁带来的收入,不同城市人们对地铁的满意度,等等数据内容,出于网上资源有限所以没有能找到可用数据。本数据集更多侧重在可视化上,实际的原因分析比较少。
