Python科学绘图4绘制多条曲线和图例及坐标轴设置
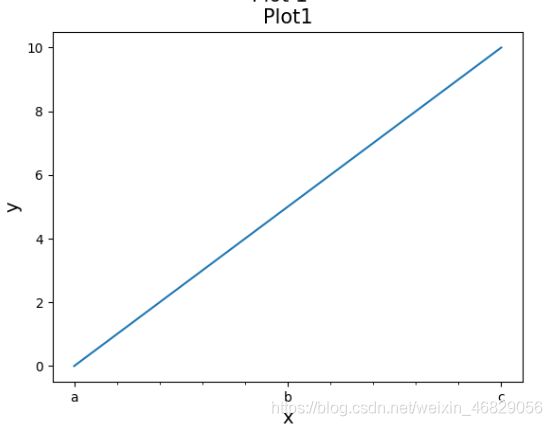
一、sub.set_xticks(数组)关键字调节坐标轴间隔
主刻度
sub.set_xticks([0,0.5,1.0])
minor关键字设置分刻度
分刻度
sub.set_xticks(np.arange(0,1.01,0.1), minor=True)
sub.set_xticklabels([‘a’, ‘b’, ‘c’])改变刻度标签
import numpy as np
import matplotlib.pyplot as plt
import pandas as pd

x = np.linspace(0, 1, 100)
y = 10 * x


fig = plt.figure()
sub = fig.add_subplot(111)
sub.plot(x, y)
sub.set_xlabel('x', fontsize=14)
sub.set_ylabel('y', fontsize=14)
sub.set_title('Plot1', fontsize=15)
fig.suptitle(r'Plot 1', fontsize = 15)
sub.set_xticks([0, 0.5, 1.0])
sub.set_xticks(np.arange(0, 1.01, 0.1), minor=True)
sub.set_xticklabels(['a', 'b', 'c'])
plt.show()
plt.close()
二、sub.grid()给坐标轴添加网格线
sub.grid()
默认情况下沿着x轴和y轴的主刻度画网格
axis=‘x’:选择添加网格线的坐标轴
sub.grid(axis=‘x’):只画x轴的网格,默认情况下axis关键字为both
which=‘major’:选择添加网格线的刻度
sub.grid(which=’major‘):只画主刻度的网格:’major‘或’minor‘或’both‘,默认情况下为主刻度
sub.grid()还可以设置
linewidth=:网格线条宽度,
linestyle=:网格线虚(线)实(线),
color=:网格线条颜色
alpha=:网格线透明度(0-1)
三、sub.tick_params()函数
刻度参数,包括了很多刻度的设置
direction:刻度方向关键字
direction=‘in’ or ’out‘ or ‘inout’ 默认值为’out‘
sub.tick_params(axis='x', which='major',direction='out')
sub.tick_params(axis='x', which='major',direction='in')
labelsize=:刻度字符大小关键字,
labelcolor=:刻度字符的颜色关键字,
colors=:同时设置刻度线的颜色和刻度字符颜色关键字
设置那个轴上有刻度
top=:True or False 表明是否要在相应的轴画刻度,默认False
bottom=:True or False表明是否要在相应的轴画刻度,默认True
left=:True or False表明是否要在相应的轴画刻度,默认True
right=:True or False表明是否要在相应的轴画刻度,默认False
设置那个轴上有标签
labeltop=:True or False 表明是否要在相应的轴画刻度,默认False
labelbottom=:True or False表明是否要在相应的轴画刻度,默认True
labelleft=:True or False表明是否要在相应的轴画刻度,默认True
labelright=:True or False表明是否要在相应的轴画刻度,默认False
labelrotation=45;标签字符旋转的角度(逆时针旋转)
sub.tick_params(axis='x', which='major', labelrotation=45)
四、如何绘制多条曲线
多次采用
sub.plot(x,y)
曲线1:y = 10 * x
曲线2:y2 = 8 * x
曲线3:y3 = 10 - 5 * x
import numpy as np
import matplotlib.pyplot as plt
import pandas as pd

x = np.linspace(0, 1, 100)
y = 10 * x
y2 = 8 * x
y3 = 10 - 5 * x

fig = plt.figure()
sub = fig.add_subplot(111)

sub.plot(x, y)
sub.plot(x, y2)
sub.plot(x, y3)


sub.set_xlabel('x', fontsize=14)
sub.set_ylabel('y', fontsize=14)
sub.set_title('Plot1', fontsize=15)
fig.suptitle(r'Plot 1', fontsize = 15)
sub.set_xticks([0, 0.5, 1.0])
sub.set_xticks(np.arange(0, 1.01, 0.1), minor=True)
sub.set_xticklabels(['a', 'b', 'c'])
plt.show()
plt.close()
五、如何添加图例
label为每一个曲线增加标签
sub.plot(x, y, label=r'y=10x')
sub.plot(x, y2, label=r'y=8x')
sub.plot(x, y3, label=r'y=10-5x')
legend()添加图例
sub.legend()
fontsize关键字:可以设置图例字体大小
loc=str:关键字图例的位置,默认情况下系统会自己找到一个最佳位置放图例,先决定上下中、再决定左右
best
upper right
upper left
lower left
lower right
right
center left
center right
lower center
upper center
center
sub.legend(loc='center left')  #中间偏左
sub.legend(loc='upper left') #顶部偏左
sub.legend(loc='upper center') #顶部中间
sub.legend(loc='best') #默认情况及尽量不与画出来的线重合
可以通过定义图例左下角在图片中的坐标指定图例位置[x,y] x,y均在0-1之间
sub.legend(loc=[0.1, 0.1])
五、图例的高级操作
指为特定线条添加图例或添加多个图例的方法
handles=[line1,line2,…]关键字给特定对象添加图例
1.去除线条本身值
sub.plot()返回值是一个python的列表,是一个2d线条对象
line = sub.plot(x, y, label=r'y=10x')
print(line)
结果
![]()
对line加,等同于直接取列表中的第一个元素即线条本身
line, = sub.plot(x, y, label=r'y=10x')
print(line)
line1, = sub.plot(x, y, label=r'y=10x')
line2, = sub.plot(x, y2, label=r'y=8x')
line3, = sub.plot(x, y3, label=r'y=10-5x')
2.handles=[line1,line2,…]关键字给特定对象添加图例
sub.legend(handles=[line1,line3])
重新定义标签名
sub.legend(handles=[line1,line3], labels=['line1', 'line3'])
添加多个图例
sub.legend(handles=[line1])
sub.legend(handles=[line2])
通过两次sub.legend()并不能出现两个图例,第一个图例被第二个图例更新了
1.sub.add_artist():把一个对象固定到图片中再生成第二个图例
leg1 = sub.legend(handles=[line1])
sub.add_artist(leg1)
sub.legend(handles=[line2])
两个图例位置重叠把生成的第二个图例换一下位置
leg1 = sub.legend(handles=[line1])
sub.add_artist(leg1)
sub.legend(handles=[line2],loc='lower center')
2.axhline(),axvline()在图片中添加参考线
在指定的y处添加一条线
sub.axhline(y=4,color='red')
在指定的x处添加一条线
sub.axvline(y=4,color='red')


