基于 TOPSIS 的复杂网络节点重要性评估
> **最近学习复杂网络,看了一篇论文,想着去复原实现其中的原理。**
在这个研究中,我们使用复杂网络理论构建了一个模型,并对其网络特性进行了分析。以下是分析过程的三个主要步骤:
使用 TOPSIS 算法评估电网中的重要节点: 通过应用 TOPSIS 算法,我们评估了贸易网络中节点的重要性。这个评估过程基于6个指标:度中心性、接近中心性、介数中心性、特征向量中心性、PageRank值和结构洞系数。这些指标都是度量网络中节点重要性的常用方法,可以帮助我们识别网络中最具影响力的节点。
利用 SIR 模型对重要节点的传播影响力进行仿真分析: 接下来,我们使用 SIR 模型来模拟网络中重要节点的传播影响力。这个模型是用来描述感染病在人群中的传播过程,但在这里,我们将其应用于贸易网络中节点的影响力传播。在这个过程中,我们假设网络中的节点可以处于三种状态:易感(S)、感染(I)和恢复(R)。模拟的目的是了解不同节点在网络中的传播效果,以便确定对整个网络最具影响力的节点。
评估节点重要性并计算感染规模: 最后,我们结合度中心性、介数中心性、接近中心性、结构洞系数作为评估指标,评估节点在网络中的重要性。根据单一指标和 TOPSIS 评估结果,我们选取重要度排名前10的节点作为初始感染源进行传播模拟。在模拟中,我们计算了相同时间内的感染规模,以便进一步评估节点重要性和网络的稳定性。
通过这三个步骤,我们能够识别出贸易网络中最具影响力的节点,并了解这些节点在网络中的传播效果。这有助于我们了解整个贸易系统的稳定性和脆弱性,为政策制定者提供有关安全和贸易政策调整的有用信息。
要用Python实现上述步骤,你需要使用一些Python库,例如networkx和numpy。以下是一些关键步骤的示例代码:
安装必要的库:
python
!pip install networkx numpy pandas导入所需的库和模块:
python
import networkx as nx
import numpy as np
import pandas as pd
from scipy.spatial.distance import cdist
创建一个示例网络:
python
G = nx.DiGraph()  # 有向图,如果是无向图,请使用 nx.Graph()
edges = [("A", "B"), ("B", "C"), ("C", "A"), ("D", "E"), ("E", "F"), ("F", "D")]
G.add_edges_from(edges)
计算各种中心性指标:
python
degree_centrality = nx.degree_centrality(G)
closeness_centrality = nx.closeness_centrality(G)
betweenness_centrality = nx.betweenness_centrality(G)
eigenvector_centrality = nx.eigenvector_centrality(G)
pagerank = nx.pagerank(G)
计算结构洞系数(需要自定义函数):
python
def structural_holes(G):
    constraint = nx.constraint(G)
    sh = {k: 1 - v for k, v in constraint.items()}
    return sh

structural_holes_centrality = structural_holes(G)
整合指标并进行TOPSIS评估:
python
def topsis(matrix, weights=None):
    if weights is None:
        weights = [1 / matrix.shape[1]] * matrix.shape[1]

    normalized_matrix = matrix / np.sqrt((matrix ** 2).sum(axis=0))

    weighted_matrix = normalized_matrix * weights

    ideal_best = np.max(weighted_matrix, axis=0)
    ideal_worst = np.min(weighted_matrix, axis=0)

    distance_best = cdist(weighted_matrix, ideal_best.reshape(1, -1), metric="euclidean").flatten()
    distance_worst = cdist(weighted_matrix, ideal_worst.reshape(1, -1), metric="euclidean").flatten()

    closeness = distance_worst / (distance_best + distance_worst)

    return closeness

metrics_data = pd.DataFrame(
    {
        "degree_centrality": degree_centrality,
        "closeness_centrality": closeness_centrality,
        "betweenness_centrality": betweenness_centrality,
        "eigenvector_centrality": eigenvector_centrality,
        "pagerank": pagerank,
        "structural_holes_centrality": structural_holes_centrality,
    }
)

topsis_scores = topsis(metrics_data.values)
SIR模型仿真(需要自定义函数):
def sir_simulation(G, initial_infected, beta, gamma, time_steps):
    susceptible = set(G.nodes()) - set(initial_infected)
    infected = set(initial_infected)
    recovered = set()

    infection_count = [len(infected)]

    for _ in range(time_steps):
        new_infected = set()
        new_recovered = set()

        for node in infected:
            neighbors = set(G.neighbors(node))
            susceptible_neighbors = neighbors.intersection(susceptible)
            for neighbor in susceptible_neighbors:
                if np.random.random() < beta:
                    new_infected.add(neighbor)

            if np.random.random() < gamma:
                new_recovered.add(node)

        susceptible -= new_infected
        infected |= new_infected
        infected -= new_recovered
        recovered |= new_recovered

        infection_count.append(len(infected))

    return infection_count
在这个示例中,我们首先创建了一个简单的示例网络,然后计算了各种中心性指标,接着使用 TOPSIS 算法对指标进行评估。最后,我们使用 SIR 模型对前10名节点进行了传播仿真。 这个示例只是为了演示如何使用 Python 实现上述步骤,你需要根据你的实际问题和数据集进行调整。请注意,这里的 SIR 模型是一个简化版,你可能需要使用更复杂的模型以获得更准确的结果。
现在我们为SIR模型定义一些参数:
python
# Define SIR model parameters
beta = 0.3
gamma = 0.1
time_steps = 50
根据TOPSIS得分,获取排名前10的节点:
python
top_nodes = metrics_data.index[np.argsort(topsis_scores)[-10:]]接下来,我们针对每个初始感染节点模拟SIR模型,并输出感染人数:
python
# Simulate the SIR model for each initial infected node
for node in top_nodes:
    initial_infected = [node]
    infection_count = sir_simulation(G, initial_infected, beta, gamma, time_steps)
    print(f"Initial infected node: {node}, infection count: {infection_count}")
这段代码将执行SIR模型仿真,并在每个时间步长内计算感染人数。请注意,这是一个简化的SIR模型,你可能需要根据你的问题和数据进行调整以获得更准确的结果。
要绘制感染规模增长图,可以使用matplotlib库。首先安装并导入所需的库:
python
!pip install matplotlib
import matplotlib.pyplot as plt
接下来,我们将创建一个函数plot_infection_growth,它将接收感染计数数据,并绘制感染规模增长图:
python
def plot_infection_growth(infection_counts, initial_infected_node):
    plt.figure(figsize=(10, 6))
    plt.plot(infection_counts)
    plt.xlabel("Time steps")
    plt.ylabel("Number of infected nodes")
    plt.title(f"Infection growth for initial infected node: {initial_infected_node}")
    plt.grid()
    plt.show()
现在,我们可以在模拟SIR模型时,针对每个初始感染节点调用plot_infection_growth函数来绘制感染规模增长图:
python
# Simulate the SIR model and plot infection growth for each initial infected node
for node in top_nodes:
    initial_infected = [node]
    infection_count = sir_simulation(G, initial_infected, beta, gamma, time_steps)
    print(f"Initial infected node: {node}, infection count: {infection_count}")
    plot_infection_growth(infection_count, node)
这段代码将针对每个初始感染节点执行SIR模型仿真,并为每个节点绘制感染规模增长图。请注意,这是一个简化的SIR模型,你可能需要根据你的问题和数据进行调整以获得更准确的结果。
此外,为了实现Nature期刊风格,你可以使用seaborn库。首先安装并导入所需的库:
python
!pip install matplotlib seaborn
import matplotlib.pyplot as plt
import seaborn as sns
设置Nature风格:
python
sns.set_style("whitegrid")现在我们将创建一个函数plot_infection_growth_comparison,它将接收包含不同指标的感染计数数据,并绘制对比图:
python
def plot_infection_growth_comparison(infection_counts_data, time_steps):
    plt.figure(figsize=(10, 6))

    for label, infection_counts in infection_counts_data.items():
        plt.plot(range(1, time_steps + 1), infection_counts, label=label)

    plt.xlabel("Time steps")
    plt.ylabel("Number of infected nodes")
    plt.title("Infection growth comparison")
    plt.legend()
    plt.grid()
    plt.show()
为了使用该函数,我们需要针对每个评估指标(度中心性、介数中心性和接近中心性)获取排名前10的节点,然后模拟SIR模型并收集感染计数数据:
python
# Get top 10 nodes for each centrality measure
top_nodes_degree = metrics_data['degree_centrality'].nlargest(10).index
top_nodes_betweenness = metrics_data['betweenness_centrality'].nlargest(10).index
top_nodes_closeness = metrics_data['closeness_centrality'].nlargest(10).index

initial_infected_nodes_list = {
    "Degree": top_nodes_degree,
    "Betweenness": top_nodes_betweenness,
    "Closeness": top_nodes_closeness,
}

infection_counts_data = {}

# Simulate the SIR model for each set of initial infected nodes
for label, initial_infected_nodes in initial_infected_nodes_list.items():
    infection_counts_sum = np.zeros(time_steps)
    for node in initial_infected_nodes:
        initial_infected = [node]
        infection_count = sir_simulation(G, initial_infected, beta, gamma, time_steps)
        infection_counts_sum += np.array(infection_count[:time_steps])
    infection_counts_avg = infection_counts_sum / len(initial_infected_nodes)
    infection_counts_data[label] = infection_counts_avg

# Plot the comparison chart
plot_infection_growth_comparison(infection_counts_data, time_steps)
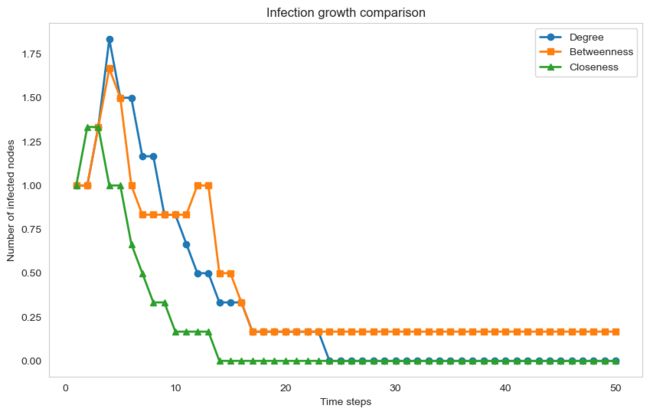
这段代码将针对每个评估指标获取排名前10的节点,模拟SIR模型,并绘制感染规模增长的对比图。请注意,这是一个简化的SIR模型,你可能需要根据你的问题和数据进行调整以获得更准确的结果。
线条调粗点,每个线条得转折点标记星或者三角形等
python
def plot_infection_growth_comparison(infection_counts_data, time_steps):
    plt.figure(figsize=(10, 6))

    markers = ['o', 's', '^']
    linewidth = 2

    for i, (label, infection_counts) in enumerate(infection_counts_data.items()):
        plt.plot(range(1, time_steps + 1), infection_counts, label=label, marker=markers[i], linewidth=linewidth)

    plt.xlabel("Time steps")
    plt.ylabel("Number of infected nodes")
    plt.title("Infection growth comparison")
    plt.legend()
    plt.grid()
    plt.show()
在这个修改后的函数中,我们为每个评估指标指定了不同的标记(圆形、正方形和三角形),并将线条粗细设置为2。你可以根据需要调整这些值。
接下来,重新运行之前的代码以生成新的对比图:
python
# Get top 10 nodes for each centrality measure
top_nodes_degree = metrics_data['degree_centrality'].nlargest(10).index
top_nodes_betweenness = metrics_data['betweenness_centrality'].nlargest(10).index
top_nodes_closeness = metrics_data['closeness_centrality'].nlargest(10).index

initial_infected_nodes_list = {
    "Degree": top_nodes_degree,
    "Betweenness": top_nodes_betweenness,
    "Closeness": top_nodes_closeness,
}

infection_counts_data = {}

# Simulate the SIR model for each set of initial infected nodes
for label, initial_infected_nodes in initial_infected_nodes_list.items():
    infection_counts_sum = np.zeros(time_steps)
    for node in initial_infected_nodes:
        initial_infected = [node]
        infection_count = sir_simulation(G, initial_infected, beta, gamma, time_steps)
        infection_counts_sum += np.array(infection_count[:time_steps])
    infection_counts_avg = infection_counts_sum / len(initial_infected_nodes)
    infection_counts_data[label] = infection_counts_avg

# Plot the comparison chart
plot_infection_growth_comparison(infection_counts_data, time_steps)
现在生成的图表应该具有粗线条和不同的标记。根据需要,你可以进一步定制图表的外观。
