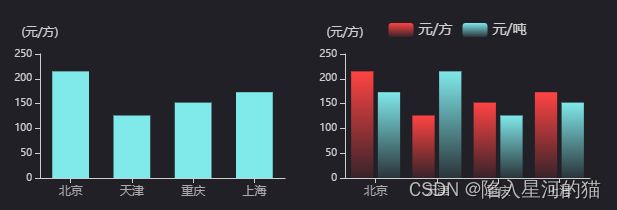
vue3 Echarts自定义组件自适应
在vue项目中实现echarts图表的自适应,F12控制台拖动页面,无需刷新,echarts图表自动适应适配屏幕,封装一个组件,通过props传递不同的数据实现不同样式的图表

- 封装一个防抖函数
export function debounce(func, wait, immediate) {
  let timeout, args, context, timestamp, result;

  const later = function () {
    // 据上一次触发时间间隔
    const last = +new Date() - timestamp;

    // 上次被包装函数被调用时间间隔 last 小于设定时间间隔 wait
    if (last < wait && last > 0) {
      timeout = setTimeout(later, wait - last);
    } else {
      timeout = null;
      // 如果设定为immediate===true,因为开始边界已经调用过了此处无需调用
      if (!immediate) {
        result = func.apply(context, args);
        if (!timeout) {
          context = args = null;
        }
      }
    }
  };

  return function (...args) {
    context = this;
    timestamp = +new Date();
    const callNow = immediate && !timeout;
    // 如果延时不存在,重新设定延时
    if (!timeout) {
      timeout = setTimeout(later, wait);
    }
    if (callNow) {
      result = func.apply(context, args);
      context = args = null;
    }

    return result;
  };
}
- 封装一个resize文件,通过缩放屏幕计算echarts宽高实现自定义适配
import { debounce } from "@/utils/tools";

export default {
    data() {
        return {
            $_sidebarElm: null,
        };
    },
    mounted() {
        this.__resizeHandler = debounce(() => {
            if (this.charts && this.charts.length) {
                this.charts.forEach((item) => {
                    item.resize();
                });
            }
        }, 200);
        window.addEventListener("resize", this.__resizeHandler);

        this.$_sidebarElm =
            document.getElementsByClassName("sidebar-container")[0];
        this.$_sidebarElm &&
            this.$_sidebarElm.addEventListener(
                "transitionend",
                this.$_sidebarResizeHandler
            );
    },
    beforeDestroy() {
        window.removeEventListener("resize", this.__resizeHandler);

        this.$_sidebarElm &&
            this.$_sidebarElm.removeEventListener(
                "transitionend",
                this.$_sidebarResizeHandler
            );
    },
    methods: {
        $_sidebarResizeHandler(e) {
            if (e.propertyName === "width") {
                this.__resizeHandler();
            }
        },
    },
};
- 封装一个bar组件,在vue bar组件中通过mixins的方式实现对组件的自适应
<template>
	<div id="bar" ref="domRef"></div>
</template>

<script>
import { getCurrentInstance, nextTick, onBeforeUnmount, ref, watch } from 'vue';
import resize from './mixins/resize';

export default {
	props: {
		// 定义需要传递的数据
	},
	setup (props) {
		const domRef = ref(null);
        const { proxy } = getCurrentInstance();
        const initChart = () => {
            if (props.barData) {
            	// 在这里详细的charts配置不再细写,可直接去echarts官网复制一个示例即可
                options = {}
                // 通过multipleBar变量控制双柱状图
                if (props.multipleBar) {
                    options.series = [];
                    for (let i = 0, data = props.barData.data; i < data.length; i++) {
                        options.series.push({});
                    }
                }
                nextTick(() => {
                    chart = proxy.$Echarts.init(domRef.value);
                    chart.setOption(options);
                    proxy.charts = [chart];
                })
            }
        }
        watch(() => props.barData, () => {
            initChart();
        }, {
            immediate: true,
            deep: true
        });
        onBeforeUnmount(() => {
            if (!chart) {
                return;
            }
            chart.dispose();
            chart = null;
            proxy.charts = null;
        });
        return {
            nullContent,
            domRef,
            initChart
        }
	}
}
</script>
- 在封装的echarts组件同级新建index.js,统一抛出封装的组件
export { default as Bar } from './Bar.vue';
.........