Python - matplotlib - pyplot绘图
matplotlib绘图
- 前言
- 基本使用:
-
- 绘图必要库
- 读取训练集
- 标题和文字说明:
- 分区域图形画法:
- 绘制四大类型图
-
- 直方图hist
- 柱状图bar:
- 散点图scatter:
- 饼状图
- 特殊技巧:
- Pandas绘图
-
- Series绘图
- DataFrame绘图
- seaborn
-
- 直方图displot:
- 核密度图kdeplot:
- 直方密度图distplot:
- 条形图countplot & barplot:
- 箱线图:
- 双变量关系图jointplot:
- 成对关系图pairplot:
- 热力图heatmap:
- 回归图implot®plot:
-
- lmplot
- regplot()
- for循环画子图
前言
Vue框架:从项目学Vue
OJ算法系列:神机百炼 - 算法详解
Linux操作系统:风后奇门 - linux
C++11:通天箓 - C++11
Python常用模块:通天箓 - Python
一行检查是否下载过Pandas:
pip list
一行下载:
pip install pandas
基本使用:
-
标记字符maker:
- 点标记:.
- 像素标记:,
- 圆形标记:o
- 倒三角标记:v
-
风格字符linestyle:
- 实线:-
- 短横线:–
- 点画线:-.
- 虚线::
-
颜色color:
- 蓝色:b
- 红色:r
- 绿色:g
- 青色:c
绘图必要库
-
matplotlib
-
matplotlib.pyplot
-
seaborn
-
pandas
-
numpy
-
备注:在notebook中使用plt绘图共有三种模式
- %matplotlib inline:这是默认的模式,直接在Notebook中输出静态图片
- %matplotlib auto:弹出一个单独的绘图窗口,和在pycharm中一样
- %matplotlib notebook:在notebook中产生一个绘图窗口,能够对图片进行放大缩小等操作
import matplotlib.pyplot as plt
import matplotlib
import seaborn as sns
import numpy as np
import warnings

warnings.filterwarnings("ignore")
# %matplotlib inline的用途:直接在Notebook中渲染图形
%matplotlib inline
读取训练集
- kaggle房价预测数据集
import pandas as pd

train = pd.read_csv('./data_set/house_price_train.csv')
print(train.shape)
print(train.dtypes)
#train.head()
#train.tail()

#查看非数值型特征值:
categorical_feats = train.dtypes[train.dtypes == 'object'].index
print(type(categorical_feats))
print('*'*100)
print(categorical_feats)

#查看数值型特征值:
value_feats = train.dtypes[train.dtypes != 'object'].index
print(type(value_feats))
print('*'*100)

#特征值数组还可以回用:
print(train[value_feats].values)
(1460, 81)
Id                 int64
MSSubClass         int64
MSZoning          object
LotFrontage      float64
LotArea            int64
                  ...
MoSold             int64
YrSold             int64
SaleType          object
SaleCondition     object
SalePrice          int64
Length: 81, dtype: object

****************************************************************************************************
Index(['MSZoning', 'Street', 'Alley', 'LotShape', 'LandContour', 'Utilities',
       'LotConfig', 'LandSlope', 'Neighborhood', 'Condition1', 'Condition2',
       'BldgType', 'HouseStyle', 'RoofStyle', 'RoofMatl', 'Exterior1st',
       'Exterior2nd', 'MasVnrType', 'ExterQual', 'ExterCond', 'Foundation',
       'BsmtQual', 'BsmtCond', 'BsmtExposure', 'BsmtFinType1', 'BsmtFinType2',
       'Heating', 'HeatingQC', 'CentralAir', 'Electrical', 'KitchenQual',
       'Functional', 'FireplaceQu', 'GarageType', 'GarageFinish', 'GarageQual',
       'GarageCond', 'PavedDrive', 'PoolQC', 'Fence', 'MiscFeature',
       'SaleType', 'SaleCondition'],
      dtype='object')

****************************************************************************************************
[[1.00000e+00 6.00000e+01 6.50000e+01 ... 2.00000e+00 2.00800e+03
  2.08500e+05]
 [2.00000e+00 2.00000e+01 8.00000e+01 ... 5.00000e+00 2.00700e+03
  1.81500e+05]
 [3.00000e+00 6.00000e+01 6.80000e+01 ... 9.00000e+00 2.00800e+03
  2.23500e+05]
 ...
 [1.45800e+03 7.00000e+01 6.60000e+01 ... 5.00000e+00 2.01000e+03
  2.66500e+05]
 [1.45900e+03 2.00000e+01 6.80000e+01 ... 4.00000e+00 2.01000e+03
  1.42125e+05]
 [1.46000e+03 2.00000e+01 7.50000e+01 ... 6.00000e+00 2.00800e+03
  1.47500e+05]]
标题和文字说明:
- xlabel:x轴下文字
- ylabel:y轴下文字
- title:图片标题
plt.title("House-SalePrice", fontsize=16) # 设置标题
plt.xlabel("SalePrice_Log", fontsize=15) # 横坐标
plt.ylabel("count", fontsize=15) # 纵坐标
print(train['LotArea'].values)
plt.plot(train['LotArea'].index, train['LotArea'].values,
         linestyle=':',marker=".",color='r')
 #":"表示虚线样式,"."表示点标记,"r"表示线为红色
plt.show()
[ 8450 9600 11250 ... 9042 9717 9937]
分区域图形画法:
- subplot():返回图形和象限
import matplotlib.pyplot as plt
plt.figure(figsize = (8, 8)) # 指定整体图片大小

fig, ax = plt.subplots(2, 2) # fig是图形对象,ax表示子图轴数组, 继续传参则为第几个子图
print(type(ax))
#ax用于区分象限区域内图形:
ax[0][0].set_title(1)
ax[0][1].set_title(2)
ax[1][0].set_title(3)
ax[1][1].set_title(4)

print(ax)
[[ ]
 [ ]]
- 用于在图形框中绘图
plt.figure(figsize = (8, 8))
fig, ax = plt.subplots(2, 2)
'''
???
'''
print(categorical_feats[:4]) # 输出对应属性值列名

for row in range(2):
    for col in range(2):
        data = train[categorical_feats[row*2+col]].value_counts()
        '''
        ???
        '''F
        ax[row][col].plot(data.index, data.values)
        ax[row][col].set_title(f'{categorical_feats[row*2+col]}')
fig.tight_layout() # 自动保持子图之间的正确间距。
plt.show()
Index(['MSZoning', 'Street', 'Alley', 'LotShape'], dtype='object')
绘制四大类型图
直方图hist
- 描述数据在各个取值中出现的次数,横轴为值,纵轴为频次
- 绘图参数只有一个x
| 参数 | 描述 |
|---|---|
| x | 必填参数,数组或者数组序列。 |
| bins | 若为整数,则是分割个数。若为数组,则是具体位置 |
| range | 指定全局间隔的下限与上限值 (min,max),元组类型,默认值为 None。 |
| density | 如果为 True,返回概率密度直方图;默认为 False,返回相应区间元素的个数的直方图。 |
| histtype | 要绘制的直方图类型,默认值为“bar”,可选值有 barstacked(堆叠条形图)、step(未填充的阶梯图)、stepfilled(已填充的阶梯图)。 |
plt.hist(x = train['SalePrice'],
         bins=50,
         density=False,
         histtype='stepfilled')
plt.show()
柱状图bar:
- 绘图参数有两个:x和height
| 参数 | 描述 |
|---|---|
| x | 一个标量序列,代表柱状图的x坐标,默认x取值是每个柱状图所在的中点位置,或者也可以是柱状图左侧边缘位置。 |
| height | 一个标量或者是标量序列,代表柱状图的高度。 |
| width | 可选参数,标量或类数组,柱状图的默认宽度值为 0.8。 |
| bottom | 可选参数,标量或类数组,柱状图的y坐标默认为None。 |
| algin | 有两个可选项 {“center”,“edge”},默认为 ‘center’,该参数决定 x 值位于柱状图的位置。 |
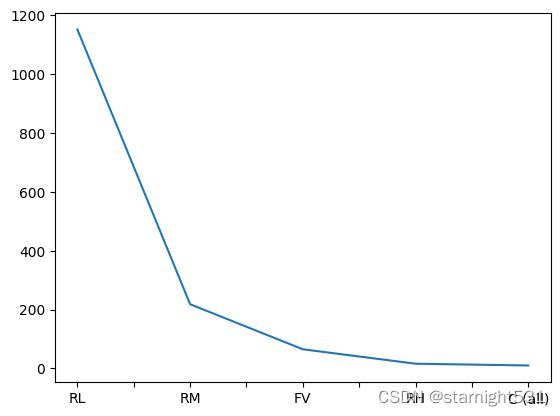
data = train['MSZoning'].value_counts()
print(data)
print(type(data))
plt.bar(x = data.index,
        height = data.values,
        width=0.5,
        align='center')
RL         1151
RM          218
FV           65
RH           16
C (all)      10
Name: MSZoning, dtype: int64
散点图scatter:
- 两个绘图参数:x+y确定点坐标
- 在水平轴和垂直轴上绘数据点
| 参数 | 描述 |
|---|---|
| x, y | 散点的坐标 |
| s | 散点的面积 |
| c | 散点的颜色(默认值为蓝色,‘b’,其余颜色同plt.plot( )) |
| marker | 散点样式(默认值为实心圆,‘o’,其余样式同plt.plot( )) |
| alpha | 散点透明度([0, 1]之间的数,0表示完全透明,1则表示完全不透明) |
| linewidths | 点的边缘线宽 |
| edgecolors | 散点的边缘颜色 |
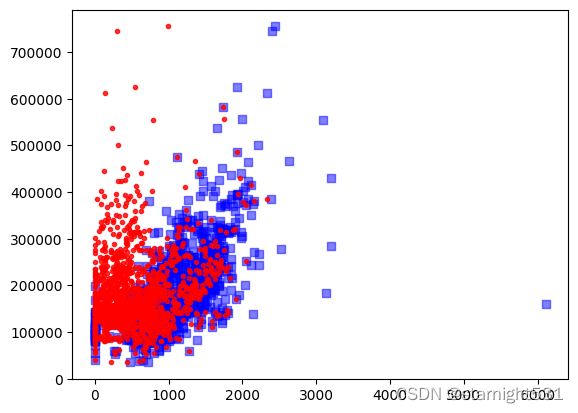
plt.scatter(x = train.TotalBsmtSF,
            y = train.SalePrice,
            c='b',
            marker=',',
            alpha=0.5
            )
plt.scatter(x = train.BsmtUnfSF,
            y = train.SalePrice,
            c='r',
            marker='.',
            alpha=0.8
            )
# 绘制多个属性到一个散点图
饼状图
- 一个绘图参数:x
| 参数 | 描述 |
|---|---|
| x | 数组序列,数组元素对应扇形区域的数量大小。 |
| explode | 突出显示,设置每一块分割出来的间隙大小 |
| labels | 列表字符串序列,为每个扇形区域备注一个标签名字。 |
| color | 为每个扇形区域设置颜色,默认按照颜色周期自动设置。 |
| autopct | 格式化字符串"fmt%pct",使用百分比的格式设置每个扇形区的标签,并将其放置在扇形区内。 |
plt.figure(figsize=(8,8))
plt.pie(
    x = train['MSZoning'].value_counts(),
    explode = (0, 0.1, 0.2, 0, 0),
    autopct = '%1.2f%%'
    )
plt.show()
特殊技巧:
-
对数化:
- 使用情况:x分布区间很广,部分y很高
- 使用目的:分布趋于正态分布
Pandas绘图
-
pandas在matplotlib基础上封装了简易绘图函数
可以直接对DataFrame和Series后加.plot()绘图 -
.plot()参数:
- kind:上述的hist、scatter、pie、bar
Series绘图
#直接绘图
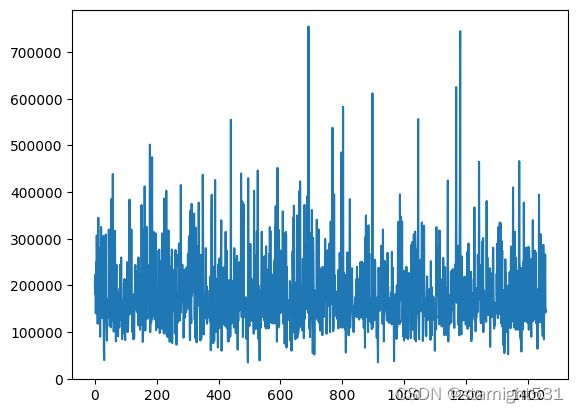
train['SalePrice'].plot()
#统计某值后绘图
train['MSZoning'].value_counts().plot()
#指定kind
train['MSZoning'].value_counts().plot(kind="bar") # 柱状图
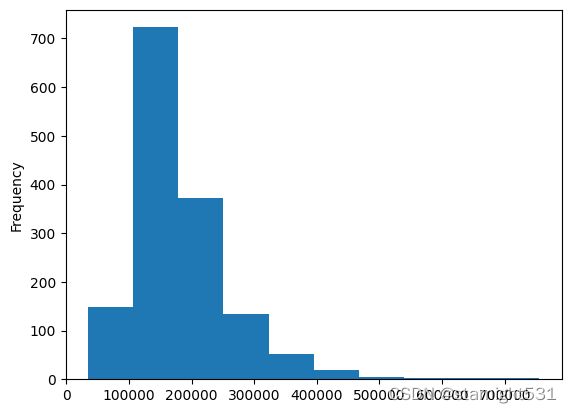
train['SalePrice'].plot.hist()
# 直方图,.hist()相当于kind='hist'
# train['SalePrice'].plot(kind='hist')
DataFrame绘图
# 部分数据直接绘图
train_d = train.loc[:,value_feats[1:5]]
print(train_d)

#不使用plot则多种数据分开绘图
train_d.hist(
    figsize=(8, 10),
    bins=50,
    xlabelsize=8,   #x轴说明字体大小
    ylabelsize=8
             )

plt.show()
      MSSubClass  LotFrontage  LotArea  OverallQual
0             60         65.0     8450            7
1             20         80.0     9600            6
2             60         68.0    11250            7
3             70         60.0     9550            7
4             60         84.0    14260            8
...          ...          ...      ...          ...
1455          60         62.0     7917            6
1456          20         85.0    13175            6
1457          70         66.0     9042            7
1458          20         68.0     9717            5
1459          20         75.0     9937            5

[1460 rows x 4 columns]
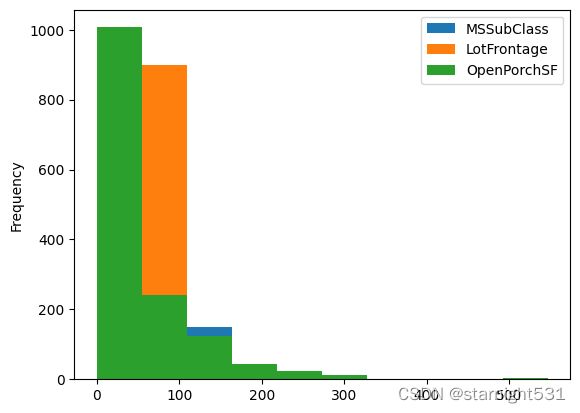
#使用plot则多种数据合并绘图
train.loc[:,['MSSubClass','LotFrontage','OpenPorchSF']].plot.hist()
# 对属性值含有NaN的列进行统计使用柱状图显示
missing = train.isnull().sum()
print(missing)
'''
此处的missing > 0指的是?
'''
missing = missing[missing > 0]
#print(missing)
missing = missing.sort_values(ascending=False)
# ascending=False 为升序
# inplace=True 为不原地修改
missing.plot.bar()
Id                 0
MSSubClass         0
MSZoning           0
LotFrontage      259
LotArea            0
                ...
MoSold             0
YrSold             0
SaleType           0
SaleCondition      0
SalePrice          0
Length: 81, dtype: int64
seaborn
-
介绍:对matplotlib进行简易化封装,但是功能不全
-
五种主题style:
- darkgrid(灰色网格)
- whitegrid(白色网格)
- dark(黑色)
- white(白色)
- ticks(十字叉)
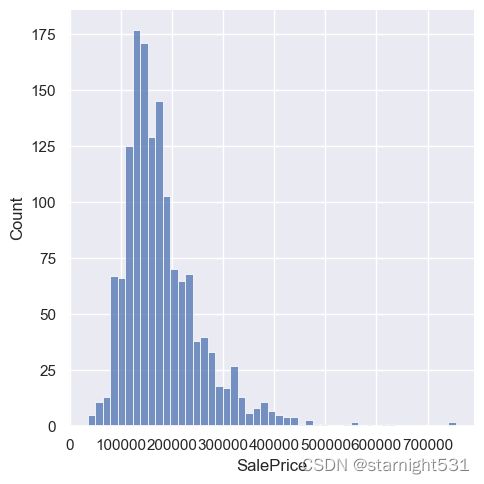
直方图displot:
import seaborn as sns
sns.set(style = "darkgrid")
sns.displot(x = train['SalePrice'])
'''
???
'''
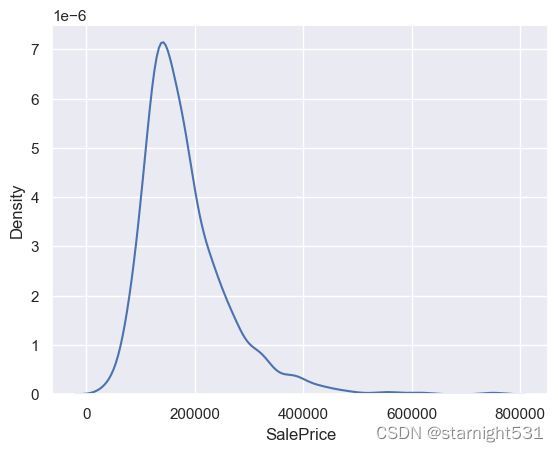
核密度图kdeplot:
- kernel density plot:
- 用途:显示数据在X轴连续数据段内的分布状况。
- 特征:这种图表是直方图的变种,使用平滑曲线来绘制水平数值,从而得出更平滑的分布。
sns.kdeplot(x = train['SalePrice'])
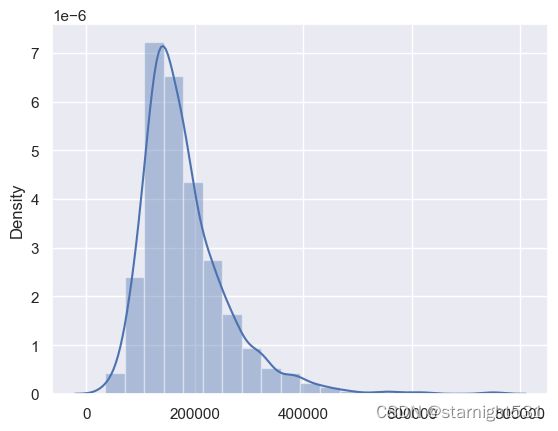
直方密度图distplot:
- 同时绘制直方图和密度图
sns.distplot(x = train["SalePrice"],bins=20, kde=True)
条形图countplot & barplot:
-
countplot:一个绘图参数data
-
barplot:两个绘图参数x&y
-
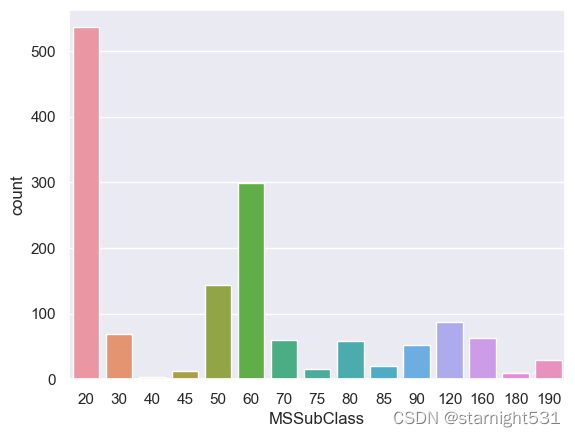
countplot
ax = sns.countplot(
    x="MSSubClass", #x轴坐标文字说明
    data = train
    )
- barplot:
- 使用条形图查看某一属性时,矩形条的方式展示数据的点估值和置信区间。
- 其中每个柱条的黑色的线条为误差线,表示数据误差范围。当误差线比较“长”时,一般要么是数据离散程度大,要么是数据样本少。
plt.figure(figsize=(10,6))
sns.barplot(x='GarageCars',y = 'SalePrice',data=train)
plt.show()
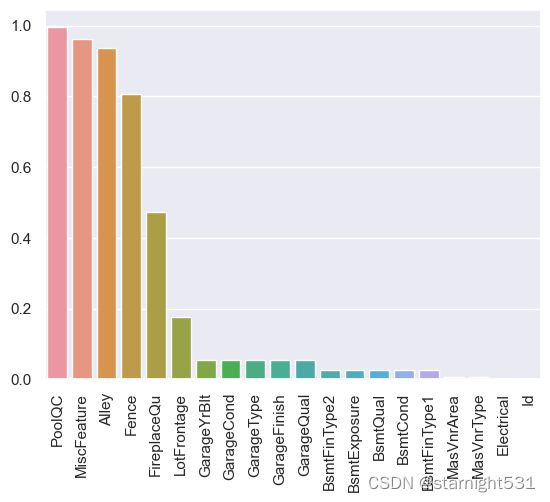
- 使用矩形图统计NaN在对应列所占比例
# 使用矩形图统计NaN在对应列所占比例
missing = train.isnull().mean()
missing = missing.sort_values(ascending=False)[:20]

# 以条形图显示NaN值在每个属性值所占比例
sns.barplot(x=missing.index,y=missing.values)
# 将x坐标表示旋转90度
plt.xticks(rotation=90)
plt.show()
箱线图:
- 优点:展现与类别相关的数据分布状况
显示出一组数据的最大值、最小值、中位数、及上下四分位数 - 两个绘图参数:x & y
plt.figure(figsize=(10,5))
sns.boxplot(
    x = 'GarageCars',
    y = 'SalePrice',
    data = train
    )
plt.show()
双变量关系图jointplot:
- 用双变量图和单变量图,绘制一个由两个变量组成的图
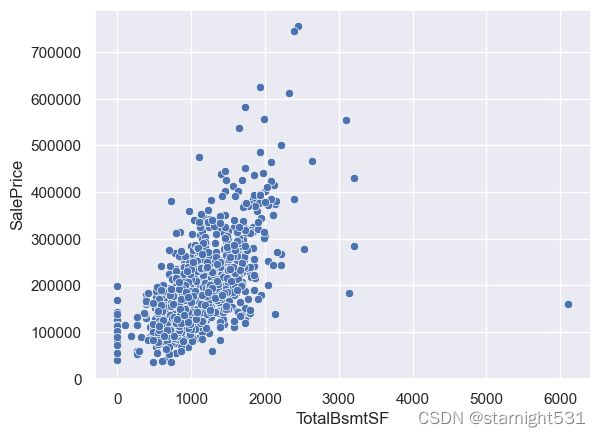
# 使用sns散点图,描述变量和房价之间的关系
sns.scatterplot(
    x = train['TotalBsmtSF'],
    y = train['SalePrice']
    )

# 使用双变量图,描述变量的分布图和变量相关的散点图组合在一起
plt.figure(figsize = (4, 3))
sns.jointplot(
    x = train.TotalBsmtSF,
    y = train.SalePrice
    )
plt.xlabel('GrLvArea')
plt.ylabel('SalePrice')
plt.title('Basis')
plt.show()
成对关系图pairplot:
- 功能:集中绘制成对关系,展示两个特征之间关系
- 方式:创建Axes网络,便于data种每个变量在y轴共享1行,x轴共享1列
- 特点:对角线为各个属性直方图,非对角线是不同属性之间的相关图
train_pair = train.loc[:,["LotArea", "GarageArea", "SalePrice"]]
tmp = sns.pairplot(data = train_pair)
print(type(tmp))
热力图heatmap:
- 功能:识别预测变量和目标变量相关性方法
import numpy as np
sns.set(font_scale=1.1)
correlation_train = train.corr()
# 返回协方差的上三角矩阵
mask = np.triu(correlation_train.corr())
'''
???mask???
'''
plt.figure(figsize=(20, 20))
sns.heatmap(data = correlation_train,
            annot = True,#是否对heatmap中每个方格写入数据。
            fmt='.1f',# 注释格式
            cmap='coolwarm',# 颜色列表
            square=True,# 将每个单元格为方形
            mask=mask,
#vmax,vmin, 图例中最大值和最小值的显示值,没有该参数时默认不显示
           )
plt.show()
# 对数据的部分列进行热力图显示
plt.figure(figsize=(10, 10))
# corr_abs = train.corr().abs()
# ser_corr = corr_abs.nlargest(len(numerical_feats), "SalePrice_Log")["SalePrice_Log"]
# cols = ser_corr[ser_corr.values > 0.43].index
cols = ['SalePrice', 'OverallQual', 'GrLivArea', 'GarageCars',
       'GarageArea', 'TotalBsmtSF', '1stFlrSF', 'FullBath', 'YearBuilt',
       'YearRemodAdd', 'TotRmsAbvGrd', 'Fireplaces']
cm = train[cols].corr()
sns.heatmap(
    data = cm,
    annot=True,
    square=True,
    fmt='.1f'
    )
plt.show()
回归图implot®plot:
-
在描绘散点图同时,输出两个变量之间线性关系
-
regplot():
- data可以是DataFrame
- x, y参数接受多种数据类型,包括numpy数组、Series
-
lmplot():
- data参数是不能为空的
- x和y参数必须以字符串形式指定。
-
regplot()支持而lmplot()不支持的类似一维数组的数据格式,被称为“long-form data”或“tidy data”
lmplot
import seaborn as sns
import pandas
train = pandas.read_csv('./data_set/house_price_train.csv')

sns.lmplot(
    x = 'OverallQual',
    y = 'SalePrice',
    data = train
)
sns.lmplot(
    x = '1stFlrSF',
    y = 'SalePrice',
    data = train
)
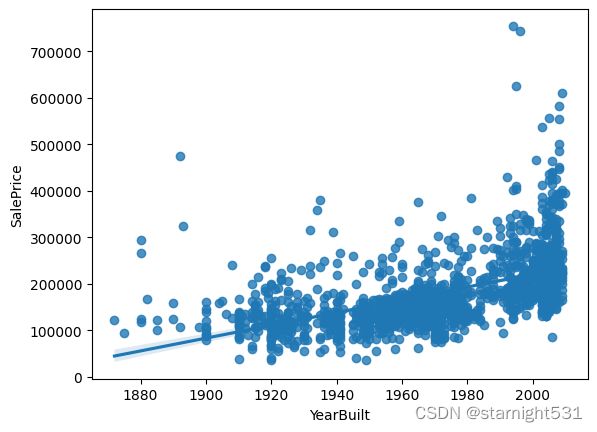
regplot()
sns.regplot(
    x = 'YearBuilt',
    y = 'SalePrice',
    data = train
    )
# order大于 1,使用numpy.polyfit来估计多项式回归,常用于进行曲线拟合的函数
sns.regplot(
    x = train['YearBuilt'],
    y = train['SalePrice'],
    order = 3
    )
for循环画子图
import matplotlib.pyplot as plt
# 使用for循环对属性遍历
fig, axes = plt.subplots(4, 3, figsize=(25, 30))
# flatten用于降维,将几个多维数组变成几个一维数组
axes = axes.flatten()
for columns, j in zip(train.select_dtypes(include=['number']).columns[:13], axes):
    print(columns,' : ', j)
    sns.regplot(
        x=columns,
        y="SalePrice",
        data=train,
        ax=j,
        order=3
        )
Id  :  AxesSubplot(0.125,0.712609;0.227941x0.167391)
MSSubClass  :  AxesSubplot(0.398529,0.712609;0.227941x0.167391)
LotFrontage  :  AxesSubplot(0.672059,0.712609;0.227941x0.167391)
LotArea  :  AxesSubplot(0.125,0.511739;0.227941x0.167391)
OverallQual  :  AxesSubplot(0.398529,0.511739;0.227941x0.167391)
OverallCond  :  AxesSubplot(0.672059,0.511739;0.227941x0.167391)
YearBuilt  :  AxesSubplot(0.125,0.31087;0.227941x0.167391)
YearRemodAdd  :  AxesSubplot(0.398529,0.31087;0.227941x0.167391)
MasVnrArea  :  AxesSubplot(0.672059,0.31087;0.227941x0.167391)
BsmtFinSF1  :  AxesSubplot(0.125,0.11;0.227941x0.167391)
BsmtFinSF2  :  AxesSubplot(0.398529,0.11;0.227941x0.167391)
BsmtUnfSF  :  AxesSubplot(0.672059,0.11;0.227941x0.167391)


