pyecharts的方法导入以及地图的制作
1.导入这个库是1.9.0以上版本
from pyecharts.charts import Bar
2.不是这个版本的要以这种方法导入
from pyecharts import Bar
bar = Bar()
bar.add_xaxis(['羽绒服','裤子','帽子','袜子','毛裤','衬衫'])
bar.add_yaxis("商家A",[5,20,36,10,75,90])
# 渲染  生成本地html文件 默认在当前目录生成render.html
# 路径参数
bar.render('my_charts.html')
3.在notebook笔记本上显示
bar.render_notebook()
4.以图片的形式保存(前提是要下载selenium)
from snapshot_selenium import snapshot
make_snapshot(snapshot, bar.render(), "bar.png")
5.全局配置项
- 初始化配置项
- 导入下面这个模块
from pyecharts import options as opts
- 导入主题
from pyecharts.globals import ThemeType
from pyecharts import options as opts
from pyecharts.charts import Bar
from pyecharts.globals import ThemeType

bar = (
    Bar(init_opts=opts.InitOpts(width="1200px",height="600px",page_title="初始化配置项",theme=ThemeType.CHALK))
    .add_xaxis(["羽绒服","衬衫","裤子","秋裤","围巾","裙子"])
    .add_yaxis("商家A",[5,20,36,10,75,90])
    .add_yaxis("商家B",[10,30,46,60,35,10])
)
# bar.render()
bar.render_notebook()
6. 标题配置项
from pyecharts.globals import ThemeType
- 导入这个模块
from pyecharts import options as opts
from pyecharts.charts import Bar
from pyecharts.globals import ThemeType

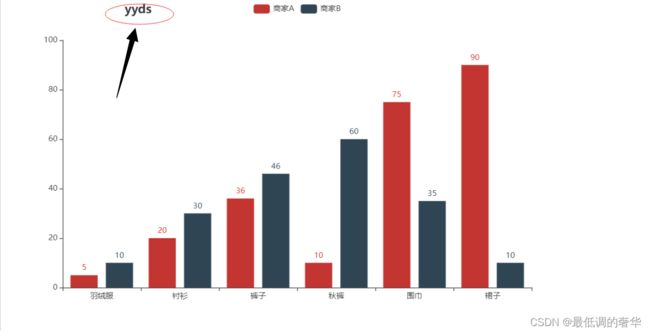
bar = (
    Bar(init_opts=opts.InitOpts())
    .add_xaxis(["羽绒服","衬衫","裤子","秋裤","围巾","裙子"])
    .add_yaxis("商家A",[5,20,36,10,75,90])
    .add_yaxis("商家B",[10,30,46,60,35,10])
    .set_global_opts(opts.TitleOpts(title="yyds",title_link="https://www.baidu.com/",pos_left="20%",item_gap=10))
)

bar.render_notebook()
- title_link 点击标题跳转百度
- pos_left 标题距离左边百分之50
- item_gap=10 主标题和副标题之间的间距
7.图例配置项
from pyecharts import options as opts
from pyecharts.charts import Bar
from pyecharts.globals import ThemeType

bar = (
    Bar(init_opts=opts.InitOpts())
    .add_xaxis(["羽绒服","衬衫","裤子","秋裤","围巾","裙子"])
    .add_yaxis("商家A",[5,20,36,10,75,90])
    .add_yaxis("商家B",[10,30,46,60,35,10])
    .set_global_opts(
        title_opts=opts.TitleOpts(title="主标题",title_link="https://www.baidu.com/",pos_left="50%"),
        legend_opts=opts.LegendOpts(is_show=True,pos_left="700px",orient="horizontal",item_width=50,legend_icon='image://https://www.baidu.com/img/PCtm_d9c8750bed0b3c7d089fa7d55720d6cf.png')

    )
)

bar.render_notebook()
- is_show 显示图例
- orient 图例列表的布局朝向。可选:‘horizontal’, ‘vertical’
- legend_icon 把链接的图片改为图例
8.区域缩放配置项
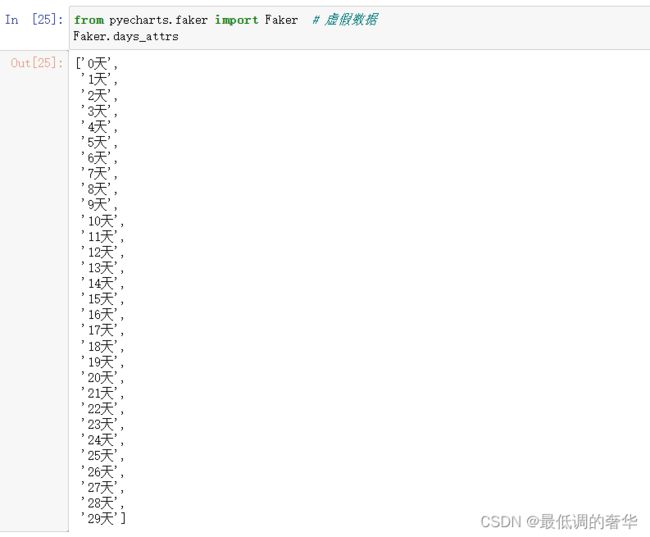
from pyecharts.faker import Faker # 虚假数据
- Faker.days_attrs 生成日期
- days_values 生成日期对应的值
from pyecharts import options as opts
from pyecharts.charts import Bar
from pyecharts.globals import ThemeType
from pyecharts.faker import Faker  # 虚假数据

bar = (
    Bar(init_opts=opts.InitOpts())
    .add_xaxis(Faker.days_attrs)
    .add_yaxis("商家A",Faker.days_values)
    .set_global_opts(
        title_opts=opts.TitleOpts(title="主标题",title_link="https://www.baidu.com/"),
        legend_opts=opts.LegendOpts(is_show=True,pos_left="700px",orient="horizontal",),
        datazoom_opts=opts.DataZoomOpts(type_="inside")
    )
)

bar.render_notebook()
- 添加 datazoom_opts=opts.DataZoomOpts(type_=“inside”)这个参数之后鼠标可以滚轮缩放
- type_=“slider” 如果是这个参数的话,会出现滑轮来滑动
9.视觉映射配置项(地图的设置)
`
from pyecharts import options as opts
from pyecharts.charts import Geo
from pyecharts.faker import Faker
from pyecharts.globals import ChartType

c = (
    Geo()
    .add_schema(maptype="铜川")
    .add(
        "geo",
        [list(z) for z in zip(Faker.guangdong_city, Faker.values())],
        type_=ChartType.HEATMAP,
    )
    .set_series_opts(label_opts=opts.LabelOpts(is_show=False))
    .set_global_opts(
        visualmap_opts=opts.VisualMapOpts(is_piecewise=False,min_=0), title_opts=opts.TitleOpts(title="Geo-广东地图")
    )

)
c.render_notebook()
from pyecharts import options as opts
from pyecharts.charts import Map
from pyecharts.faker import Faker
from pyecharts.globals import ChartType
c = (
    Map()
    .add("商家A", [list(z) for z in zip(['吴起县','志丹县','安塞区'], [100,50,44])], "延安")
    .set_global_opts(
        title_opts=opts.TitleOpts(title="Map-广东地图"),
        visualmap_opts=opts.VisualMapOpts(),
    )
)
print(Faker.guangdong_city)
c.render_notebook()
10.工具箱配置项
from pyecharts import options as opts
from pyecharts.charts import Bar
from pyecharts.faker import Faker

c = (
    Bar()
    .add_xaxis(Faker.choose())
    .add_yaxis("商家A", Faker.values())
    .add_yaxis("商家B", Faker.values())
    .set_global_opts(
        title_opts=opts.TitleOpts(title="Bar-显示 ToolBox"),
        toolbox_opts=opts.ToolboxOpts(),
        legend_opts=opts.LegendOpts(is_show=True),
    )

)


