js echarts踩坑记录

最近有遇到要用echart的场景,踩了几个坑,在此记录下,
ehchart的官网
dat工具 用于做选项设置,可以动态改变echart的设置,如下图
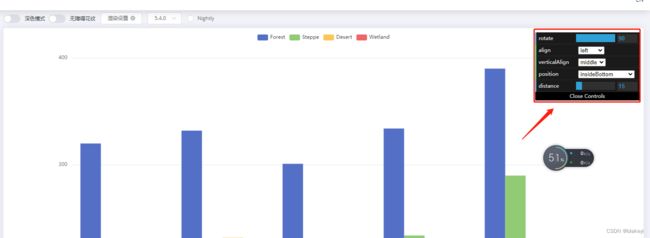
js echarts踩坑记录_第1张图片

高级柱状图

  • 问题1.echart在vue中使用时,报错 echarts Cannot read properties of undefined (reading ‘init’)
    问题原因:用的echarts版本是 "echarts": "^5.4.0", 导入的时候是 import echarts from 'echarts' , 应该是5.4.0版本上api做了拆分, 把导入改成import * as echarts from "echarts"; 就行了

  • 问题2 调用echarts.init 时报错 echarts Initialize failed: invalid dom
    问题原因:初始化时未获取到dom元素, 检查下挂载的dom元素是不是放在v-if或者v-show中, 或者检查echarts.init的调用时机(最好在mounted中)

  • 问题3 dat.gui的使用问题, 在官方的示例中是做了封装处理, 无法看到是怎么初始化dat的, 下面给个示例代码

			let dom_chart = document.getElementById('echarts_container');
            if (!this.chart) {
                this.chart = echarts.init(dom_chart, null, {
                    renderer: 'canvas',
                    useDirtyRect: false
                });
            }

            // datgui参数
            var app = {};
            var option;
            const posList = [
                'left',
                'right',
                'top',
                'bottom',
                'inside',
                'insideTop',
                'insideLeft',
                'insideRight',
                'insideBottom',
                'insideTopLeft',
                'insideTopRight',
                'insideBottomLeft',
                'insideBottomRight'
            ];
            app.configParameters = {
                rotate: {
                    min: -90,
                    max: 90
                },
                align: {
                    options: {
                        left: 'left',
                        center: 'center',
                        right: 'right'
                    }
                },
                verticalAlign: {
                    options: {
                        top: 'top',
                        middle: 'middle',
                        bottom: 'bottom'
                    }
                },
                position: {
                    options: posList.reduce(function (map, pos) {
                        map[pos] = pos;
                        return map;
                    }, {})
                },
                distance: {
                    min: 0,
                    max: 100
                }
            };
            let that = this
            app.config = {
                rotate: 90,
                align: 'left',
                verticalAlign: 'middle',
                position: 'insideBottom',
                distance: 15,
                onChange: function () {
                    const labelOption = {
                        rotate: app.config.rotate,
                        align: app.config.align,
                        verticalAlign: app.config.verticalAlign,
                        position: app.config.position,
                        distance: app.config.distance
                    };
                    that.chart.setOption({
                        series: [
                            {
                                label: labelOption
                            },
                            {
                                label: labelOption
                            },
                            {
                                label: labelOption
                            },
                            {
                                label: labelOption
                            }
                        ]
                    });
                }
            };
            const labelOption = {
                show: true,
                position: app.config.position,
                distance: app.config.distance,
                align: app.config.align,
                verticalAlign: app.config.verticalAlign,
                rotate: app.config.rotate,
                formatter: '{c}  {name|{a}}',
                fontSize: 16,
                rich: {
                    name: {}
                }
            };

            // 数据
            option = {
                tooltip: {
                    trigger: 'axis',
                    axisPointer: {
                        type: 'shadow'
                    }
                },
                legend: {
                    data: ['Forest', 'Steppe', 'Desert', 'Wetland']
                },
                toolbox: {
                    show: true,
                    orient: 'vertical',
                    left: 'right',
                    top: 'center',
                    feature: {
                        mark: { show: true },
                        dataView: { show: true, readOnly: false },
                        magicType: { show: true, type: ['line', 'bar', 'stack'] },
                        restore: { show: true },
                        saveAsImage: { show: true }
                    }
                },
                xAxis: [
                    {
                        type: 'category',
                        axisTick: { show: false },
                        data: ['2012', '2013', '2014', '2015', '2016']
                    }
                ],
                yAxis: [
                    {
                        type: 'value'
                    }
                ],
                series: [
                    {
                        name: 'Forest',
                        type: 'bar',
                        barGap: 0,
                        label: labelOption,
                        emphasis: {
                            focus: 'series'
                        },
                        data: [320, 332, 301, 334, 390]
                    },
                    {
                        name: 'Steppe',
                        type: 'bar',
                        label: labelOption,
                        emphasis: {
                            focus: 'series'
                        },
                        data: [220, 182, 191, 234, 290]
                    },
                    {
                        name: 'Desert',
                        type: 'bar',
                        label: labelOption,
                        emphasis: {
                            focus: 'series'
                        },
                        data: [150, 232, 201, 154, 190]
                    },
                    {
                        name: 'Wetland',
                        type: 'bar',
                        label: labelOption,
                        emphasis: {
                            focus: 'series'
                        },
                        data: [98, 77, 101, 99, 40]
                    }
                ]
            };

            if (option && typeof option === 'object') {
                this.chart.setOption(option);
            }
            if (!this.datgui) {
                this.datgui = new datgui.GUI({ name: '选项设置', autoPlace: true });
            }

            // 设置显示位置
            let dom_dat = document.getElementsByClassName('dg ac');
            // 通过获得chart的位置来设置datgui的位置
            let pos = this.getDomAbsolutePos(dom_chart)
            dom_dat[0].style.top = `${pos.top}px`

            // 设置datgui, onChange中执行echart逻辑
            for (let key of Object.keys(app.configParameters)) {
                // 先判断参数类型
                const param = app.configParameters[key]
                if ("min" in param) {
                    // 范围值的
                    this.datgui.add(app.config, key).min(param.min).max(param.max).onChange(app.config.onChange)
                } else if ("options" in param) {
                    // 下拉框的
                    this.datgui.add(app.config, key, param.options).onChange(app.config.onChange)
                }
            }

            window.addEventListener('resize', this.chart.resize);
        getDomAbsolutePos(obj) {
            let top = 5 - obj.clientHeight, left = 0;
            //从目标元素开始向外遍历,累加top和left值  
            for (; obj != null; obj = obj.offsetParent) {
                top += obj.offsetTop;
                left += obj.offsetLeft;
            }
            return {
                top,
                left
            }
        },

你可能感兴趣的:(前端,echarts,javascript,vue.js)