mysql自用辅助运维脚本
一、事务状态脚本
根据事务开始时间排序的脚本,可以展示事务的执行时间
SELECT
    trx_mysql_thread_id as id,concat(t.PROCESSLIST_USER,'@',t.PROCESSLIST_HOST,':',t.PROCESSLIST_DB) As connection,
    trx_state,trx_started,concat(timestampdiff(SECOND,trx_started,CURRENT_TIMESTAMP()),'s') AS duration,
    trx_query,t.processlist_state as state,sum(h.rows_examined) as trx_rows_examined,trx_rows_locked,trx_rows_modified,trx_isolation_level,
    group_concat(h.sql_text order by h.TIMER_START DESC SEPARATOR ';\n') As thd_last_query,t.thread_id
FROM
    information_schema.INNODB_TRX b
LEFT JOIN performance_schema.threads t on t.processlist_id = b.trx_mysql_thread_id
LEFT JOIN performance_schema.events_statements_history h USING(thread_id)
where (trx_operation_state != 'sleeping before entering InnoDB' or trx_operation_state is null)
group by thread_id order by trx_started
输出字段解释:
id:会话ID,可以使用kill + id结束该会话。
connection:连接信息,user@ip:db。
trx_state:事务执行状态,有RUNNING、LOCK WAIT、ROLLING BACK、COMMITTING四种状态。
trx_started:事务打开时间。
duration:事务执行时长,单位秒。
trx_query:事务当前运行SQL,如果为空,说明事务处于挂起状态,可以结合thd_last_query定位代码位置。
state:线程会话当前状态。
thd_rows_examined:线程扫描行数。
trx_rows_locked:事务持有行锁数。
trx_rows_modified:事务影响行数。
trx_isolation_level:事务隔离级别。
thd_last_query:线程包含的历史SQL(按照执行时间倒序且默认最多存在10条SQL),如果事务处于挂起状态,则可以根据历史执行SQL找出代码位置。
thread_id:线程id。
注意点:此脚本可以知道MySQL中所有活跃事务的当前状态。但是需要注意,如果事务执行的第一条SQL就被全局读锁或者元数据锁卡住,则无法从该脚本中看到,即INNODB_TRX表看不到这个未真正开始的事务;如果第二条或后面的SQL执行被卡主,则可以看到。
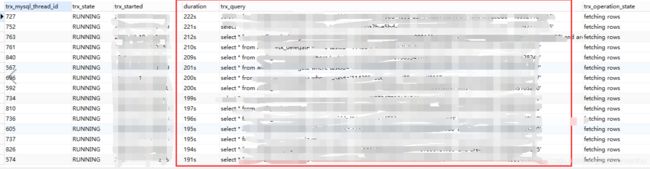
问题样例(1):MySQL服务器cpu爆满,脚本输出如下,duration比较大,大量事务卡在同一条SQL执行上,分析该SQL发现缺少索引,加上索引后cpu正常。
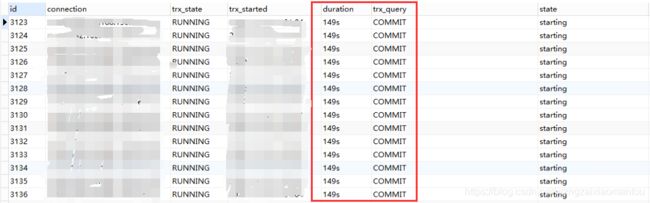
问题样例(2):业务系统访问超时,脚本输出如下,很多事务卡在commit上,登陆MySQL服务器检查后发现磁盘爆满所致。
问题样例(3):事务挂起问题,事务挂起容易导致锁等待,挂起的原因有很多,最常见的就是接口问题。模拟问题环境脚本输出如下,可以看到事务运行了非常久,但是trx_query列为空,说明会话此时并不在执行SQL,我们可以通过thd_last_quert看下事务会话之前运行过哪些SQL,再根据历史SQL去代码中定位原因。
![]()
二、表锁等待脚本
SELECT
    concat('kill ',id,';') as kill_sql,concat(user,'@',host,':',db) As connection,command,time,state,info,trx_started
FROM
    INFORMATION_SCHEMA.processlist p left join INFORMATION_SCHEMA.INNODB_TRX trx on p.id = trx.trx_mysql_thread_id
WHERE (TO_SECONDS(now())-TO_SECONDS(trx_started) >=  (SELECT MAX(Time)  FROM INFORMATION_SCHEMA.processlist
WHERE STATE like 'Waiting for%' and command != 'Daemon') or STATE like 'Waiting for%') and command != 'Daemon'
order by trx_started desc,time desc
输出字段解释:
kill_sql:拼接好的kill命令。
connection:线程连接信息。
command:线程执行命令。
time:线程处于当前状态的时间,单位秒。
state:线程状态,常见的有:
Waiting for table flush 等待表关闭。
Waiting for global read lock 等待全局读锁。
Waiting for table metadata lock 等待表元数据锁。
info:线程当前执行的SQL。
trx_started:事务打开时间。
三、行锁等待脚本
SELECT
    r.trx_mysql_thread_id waiting_id,b.trx_mysql_thread_id blocking_id,
    concat(timestampdiff(SECOND,r.trx_wait_started,CURRENT_TIMESTAMP()),'s') AS duration,
    t.processlist_command state,r.trx_query waiting_query,b.trx_query blocking_current_query,
    group_concat(h.sql_text order by h.TIMER_START DESC SEPARATOR ';\n') As thd_last_query
FROM
    information_schema.innodb_lock_waits w
JOIN information_schema.innodb_trx b ON b.trx_id = w.blocking_trx_id
JOIN information_schema.innodb_trx r ON r.trx_id = w.requesting_trx_id
LEFT JOIN performance_schema.threads t on t.processlist_id = b.trx_mysql_thread_id
LEFT JOIN performance_schema.events_statements_history h USING(thread_id)
group by thread_id order by r.trx_wait_started
输出字段解释:
waiting_id:等待线程id。
blocking_id:阻塞线程id。
duration:行锁等待时间。
state:阻塞线程状态,sleep代表事务挂起。
waiting_query:等待SQL。
blocking_current_query:阻塞SQL,为空代表事务挂起。
thd_last_query:阻塞线程历史SQL,事务挂起时可以通过该列排查。