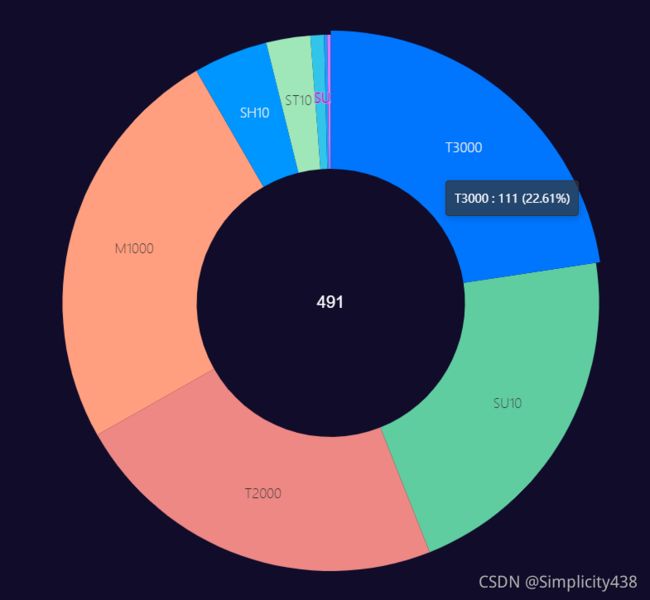
vue+echarts饼图
<template>
  <!-- 2.为echart准备一个具备大小的容器 -->
  <div id="stat-model"
       style="width:200px;height:200px"></div>
</template>
<script>
// 1.导入echart
import * as echarts from 'echarts'
// 3.基于准备好的dom,初始化echarts实例
var myChart = echarts.init(document.getElementById('stat-model'))
// 4.准备数据和配置项
var option = {
    // 提示框组件
    tooltip: {
        trigger: 'item',   // trigger 触发方式,放到图形上触发提示
        // 格式化提示内容:a 代表series系列图表名称;b 代表series数据名称 data 里面的name;c 代表series数据值 data 里面的value;d代表 当前数据/总数据的比例
        formatter: "{b} : {c} ({d}%)",
        backgroundColor:'rgba(50,50,50,0.7)',
        borderColor:'rgba(51,51,51)',
        confine: true, // 防止提示框被遮挡
        // 改变标示文字的颜色
        textStyle: {
             color: '#fff'
        }
    },
    // 注意颜色写的位置
    color: [
      "#006cff",
      "#60cda0",
      "#ed8884",
      "#ff9f7f",
      "#0096ff",
      "#9fe6b8",
      "#32c5e9",
      "#1d9dff"
    ],
    // 图表中间
    graphic: {
          type: "group",
          top: "middle",
          left: "center",
          height: 80,
          children: [
            {
              type: "text",
              left: "center",
              top: "20%",
              style: {
                text: "491",
                textAlign: "center",
                textVerticaAlign: "middle",
                fill: "#fff",  //字体颜色
                font: "20px Helvetica",
              }
            },

          ]
        },
    // 控制图表
    series: [
        {
            type: 'pie',  // 图表类型
            radius: ['40%', '80%'],  //第一项是内半径,第二项是外半径(通过它可以实现饼形图大小)
            // 图表中心位置 left 50%  top 50%  距离图表DOM容器  在容器中间显示
            center: ["50%", "50%"],
            // 修饰饼形图文字相关的样式 label对象
            label: {
                show: true,
                position: 'inner',
                textStyle : {
                    fontWeight : 300 ,
                    fontSize : 16    //文字的字体大小
                },
                formatter: "{b}",
            },
            // 修饰引导线样式
            labelLine: {
                show: false
            },
            data: [
                {value: 111, name: 'T3000'},
                {value: 105, name: 'SU10'},
                {value: 112, name: 'T2000'},
                {value: 122, name: 'M1000'},
                {value: 22, name: 'SH10'},
                {value: 13, name: 'ST10'},
                {value: 4, name: 'D10'},
                {value: 1, name: 'SA10'},
                {value: 1, name: 'SU20'},
            ]
        }
    ]
};
</script>
