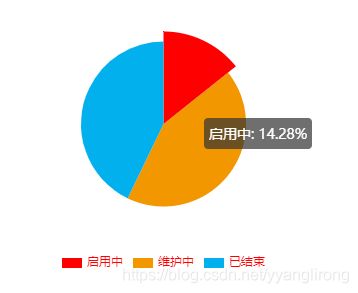
Echarts绘制饼状图Vue
首先安装,引入。
新建一个pieEcharts组件
<template>
  <div :ref="id" style="height: 100%"></div>
</template>

<script lang="ts">
import { Component, Vue, Prop, Watch } from "vue-property-decorator";
import echarts from "echarts";

@Component({})
export default class extends Vue {
  myChart: any;

  @Prop({ required: true }) id!: string; //id区分多个饼图
  @Prop({ required: true }) pieData!: Array<any>; //数据
  @Prop({ required: true }) level!: Array<any>; //分类数据

  mounted() {
    this.$nextTick(() => {
      this.myChart = echarts.init(this.$refs[this.id] as HTMLCanvasElement);
      this.initPieCharts();
    });
  }

  initPieCharts() {
    const o = this.pieData;
    const l = this.level;
    const option = {
      tooltip: {
        trigger: "item",
        formatter: "{b}: {d}%", // 默认值null,内容格式器
      },
      color: ["#FE0000", "#F29700", "#02B0ED"], //颜色
      series: [
        {
          type: "pie",
          radius: "55%", // 大小, //饼图的位置
          label: {
            show: false,
          },
          labelLine: {
            show: false,
          },
          data: o || [],
        },
      ],
      legend: {
        left: "center",
        top: "bottom", //居中底部显示
        itemWidth: 20,
        itemHeight: 10,
        formatter: "{name}",
        textStyle: {
          color: "#FE0000",
        },
        data: l || [],
        calculable: true,
      },
    };
    this.myChart.setOption(option);
  }

  @Watch("pieData", { deep: true })
  onChangeValue(newValue: Array<any>) {
    this.initPieCharts();
  }
}
</script>

<style scoped lang="scss"></style>
引用
<template>
  <div class="customerData">
    <div class="data-wrap df df-b">
      <div class="data-item" v-for="(v, i) in pageConfig" :key="i">
        <div class="line-content">
          <pieEcharts
            class="pie"
            id="identify"
            :level="v.level"
            :pieData="v.pieData"
          ></pieEcharts>
        </div>
      </div>
    </div>
  </div>
</template>

<script lang="ts">
import { Component, Vue } from "vue-property-decorator";
import pieEcharts from "@/components/pieEcharts.vue";
import { _customerDate } from "@/utils/pageConfig/data/_customerDat";

@Component({
  components: {
    pieEcharts,
  },
})
export default class extends Vue {
  pageData: any = {};
  pageConfig: Array<any> = _customerDate;//数据,
}
</script>

<style scoped lang="scss">
.customerData {
  padding: 20px 100px;
  background-color: #ffffff;
  .title {
    font-size: 24px;
    font-weight: bold;
    margin: 40px 0;
    text-align: center;
  }
  .data-wrap {
    flex-wrap: wrap;
    .data-item {
      width: 47%;
      padding: 28px;
      margin-bottom: 40px;
      font-size: 14px;
      box-shadow: 0 2px 12px 0 rgba(0, 0, 0, 0.1);
      border-radius: 4px;
      .data {
        text-align: center;
        margin-top: 22px;
        span {
          font-size: 18px;
          font-weight: bold;
        }
      }
      .line-content {
        height: 300px;
      }
    }
  }
}
</style>
数据
export const _customerDate = [
    {
        label: '平台客户概况',
        time: "2020-12-3",
        date: 'dateRange',
        data: 'total',
        pieData: [  //实际开发中请求后端接口替换这段数据即可
            { value: 50, name: "启用中", itemStyle: { normal: { color: "#FE0000" } } },
            {
                value: 150,
                name: "维护中",
                itemStyle: { normal: { color: "#F29700" } },
            },
            {
                value: 150,
                name: "已结束",
                itemStyle: { normal: { color: "#02B0ED" } },
            }
        ],
        level: [
            { name: "启用中", icon: "rect" },
            { name: "维护中", icon: "rect" },
            { name: "已结束", icon: "rect" },
        ],
    }
最后效果:

补充:formatter 参数是内容显示器,内置abcd,四个参数,可以把四个参数都显示出来,然后根据业务情况选择格式,就是这个内容![]()