目录
- 基于 python pulp 库求解船舶泊位调度线性规划问题
-
基于 python pulp 库求解船舶泊位调度线性规划问题
泊位调度问题建模
- 船舶泊位调度问题指将进港的船舶有序规划, 使各个船舶进港, 离港时间和位置都不冲突
- 由于是帮朋友做的, 他直接把模型给了我, 建模本人也不太了解, 下面就直接放一下模型.
min f ( x , y , z ) = ∑ i = 1 T { c 1 i ∣ x i − p i ∣ + c 2 i ( y i + b i − d i ) + } s . t . { x i + l i ≤ L , i = 1 , 2 , ⋯ , L x i + l i ≤ x j + M ( 1 − Z i j x ) , i = 1 , ⋯ , l ; j = 1 , ⋯ , l ; i ≠ j y i + b i ≤ y j + M ( 1 − Z i j y ) , i = 1 , ⋯ , l ; j = 1 , ⋯ , l ; i ≠ j Z i j x + Z i j y + Z j i x + Z j i y ≥ 1 , i = 1 , ⋯ , l ; j = 1 , ⋯ , l ; i < j y i ≥ a i , i = 1 , ⋯ , l x i ≥ 0 , i = 1 , ⋯ , l Z i j x , Z i j y = 0 , 1 , i = 1 , ⋯ , l ; j = 1 , ⋯ , l ; i ≠ j \min f(x, y, z)=\sum_{i=1}^{T}\left\{c_{1 i}\left|x_{i}-p_{i}\right|+c_{2 i}\left(y_{i}+b_{i}-d_{i}\right)^{+}\right\} \\ s.t. \left\{ \begin{array}{l} x_{i}+l_{i} \leq L, i=1,2, \cdots, L \\ x_{i}+l_{i} \leq x_{j}+M\left(1-Z_{i j}^{x}\right), i=1, \cdots, l ; j=1, \cdots, l ; i \neq j \\ y_{i}+b_{i} \leq y_{j}+M\left(1-Z_{i j}^{y}\right), i=1, \cdots, l ; j=1, \cdots, l ; i \neq j \\ Z_{i j}^{x}+Z_{i j}^{y}+Z_{j i}^{x}+Z_{j i}^{y} \geq 1, i=1, \cdots, l ; j=1, \cdots, l ; iminf(x,y,z)=i=1∑T{c1i∣xi−pi∣+c2i(yi+bi−di)+}s.t.⎩ ⎨ ⎧xi+li≤L,i=1,2,⋯,Lxi+li≤xj+M(1−Zijx),i=1,⋯,l;j=1,⋯,l;i=jyi+bi≤yj+M(1−Zijy),i=1,⋯,l;j=1,⋯,l;i=jZijx+Zijy+Zjix+Zjiy≥1,i=1,⋯,l;j=1,⋯,l;i<jyi≥ai,i=1,⋯,lxi≥0,i=1,⋯,lZijx,Zijy=0,1,i=1,⋯,l;j=1,⋯,l;i=j
- 其中 p i , a i , b i , d i , l i , c 1 i , c 2 i p_i,a_i,b_i,d_i,l_i,c_{1i},c_{2i} pi,ai,bi,di,li,c1i,c2i均为随机生成的参数
代码实现
准备包
- Pulp 库安装:
pip install PuLP(anaconda 不能使用conda install PuLP, conda 库里没有 Pulp 包)
- Pulp 库的使用可以看看 YouCans 大大的文章, 这里就不过多介绍了
- matplotlib:
conda install matplotlib
- pandas:
conda install pandas
代码讲解
createPara(l)随机生成模型中的参数并存储到 dataframe 中
def createPara(l):
'''
用df存储随机生成的参数
Args:
l (int): number of vessels
Returns:
dataframe: 参数表格
'''
df = pd.DataFrame()
df['vessel'] = list(range(l))
df['p_i'] = [
random.randint(0, 550) for i in range(l)
]
df['a_i'] = [
random.randint(0, 75) for i in range(l)
]
df['b_i'] = [
random.randint(6, 11) for i in range(l)
]
df['d_i'] = [
random.randint(0, 100) for i in range(l)
]
df['l_i'] = [random.randint(150, 300) for i in range(l)]
df['c_{1i}'] = [
random.randint(5, 9) for i in range(l)
]
df['c_{2i}'] = [random.randint(5, 9) for i in range(l)]
return df
createVar(l)函数根据船只数生成对应变量(根据模型,船只数变化时,变量数量是要变化的)
def createVar(l):
'''
创建变量
Args:
l (int): number of vessels
Returns:
list: 每个列表存储不同种类的变量
'''
x_variables = ['x_' + str(i) for i in range(l)]
y_variables = ['y_' + str(i) for i in range(l)]
zx_variables = [
[f'zx_{i}{j}' for j in range(l)] for i in range(l)
]
zy_variables = [
[f'zy_{i}{j}' for j in range(l)] for i in range(l)
]
abs_variables = [
f'abs_{i}' for i in range(l)
]
return x_variables, y_variables, zx_variables, zy_variables, abs_variables
createPulpVar(x_variables, y_variables, zx_variables, zy_variables, abs_variables)函数将createVar(l)函数生成的变量转换为pulp库中的变量PulpVar
def createPulpVar(x_variables, y_variables, zx_variables, zy_variables, abs_variables):
'''
将变量转换为pulp变量
直接创建变量是不能用在pulp中的, 需要将变量转换为pulp的变量, 在目标函数和约束条件中必须使用pulp变量
Args:
x_variables (lsit): berth location
y_variables (list): berthing time
zx_variables (list): if vessel i located to the left_hand of vessel j
zy_variables (list): if vessel i located below vessel j
abs_variables (list): a variable to replace the absolute value
'''
BerthLocation = pulp.LpVariable.dicts(
'BerthLocation', x_variables, lowBound=0, cat='Integer'
)
BerthTime = pulp.LpVariable.dicts(
'BerthTime', y_variables, lowBound=0, cat='Integer'
)
LeftSide = pulp.LpVariable.dicts(
'LeftSide',
[item for row in zx_variables for item in row],
lowBound=0,
cat='Binary',
)
Below = pulp.LpVariable.dicts(
'Below',
[item for row in zy_variables for item in row],
lowBound=0,
cat='Binary',
)
Abs = pulp.LpVariable.dicts(
'Abs', abs_variables, lowBound=0, cat='Integer'
)
return BerthLocation, BerthTime, LeftSide, Below, Abs
main(l)主函数, 输入船只数, 调用上述函数, 生成模型并进行求解
def main(l):
'''
线性规划模型
Args:
l (int): number of vessels
'''
model = pulp.LpProblem('BerthAllocation', pulp.LpMinimize)
df = createPara(l)
print('参数列表:')
print(df)
x_variables, y_variables, zx_variables, zy_variables, abs_variables = createVar(
l
)
BerthLocation, BerthTime, LeftSide, Below, Abs = createPulpVar(
x_variables, y_variables, zx_variables, zy_variables, abs_variables
)
model += pulp.lpSum(
[
df.iloc[i, 6]
* (Abs[abs_variables[i]])
+ df.iloc[i, 7]
* (BerthTime[y_variables[i]] + df.iloc[i, 3] - df.iloc[i, 4])
for i in range(l)
]
)
for i in range(l):
model += (
Abs[abs_variables[i]] >= BerthLocation[x_variables[i]] - df.iloc[i, 1]
)
model += (
Abs[abs_variables[i]] >= -BerthLocation[x_variables[i]] + df.iloc[i, 1]
)
model += BerthLocation[x_variables[i]] + df.iloc[i, 5] <= L
model += BerthTime[y_variables[i]] >= df.iloc[i, 2]
model += (
BerthTime[y_variables[i]] + df.iloc[i, 3] - df.iloc[i, 4] >= 0
)
for j in range(l):
if i < j:
model += (
LeftSide[zx_variables[i][j]]
+ Below[zy_variables[i][j]]
+ LeftSide[zx_variables[j][i]]
+ Below[zy_variables[j][i]]
>= 1
)
if i != j:
model += (
BerthLocation[x_variables[i]] + df.iloc[i, 5]
<= BerthLocation[x_variables[j]]
+ (1 - LeftSide[zx_variables[i][j]]) * M
)
model += (
BerthTime[y_variables[i]] + df.iloc[i, 3]
<= BerthTime[y_variables[j]] + (1 - Below[zy_variables[i][j]]) * M
)
model.solve(
pulp.apis.PULP_CBC_CMD(msg=False)
)
print(
"求解状态:", pulp.LpStatus[model.status]
)
if pulp.LpStatus[model.status] == 'Optimal':
draw(model, l, df)
print("最优总成本 = ", pulp.value(model.objective))
绘制图像
getColor()函数以及draw(model, l, df)用于可视化结果.
- 单纯看结果的
'Optimal'(有最优解)或'Infeasible'(无解)不够直观
- 设计了两个函数, 用于在有最优解时, 绘制出最优解对应的船舶调度方案和目标值, 给出更直观的图像
getColor()函数用以给各个船舶随机生成颜色
def getColor():
    '''
    生成随机颜色以上色

    '''
    color1 = random.randint(16, 255)
    color2 = random.randint(16, 255)
    color3 = random.randint(16, 255)
    color1 = hex(color1)
    color2 = hex(color2)
    color3 = hex(color3)
    ans = "#" + color1[2:] + color2[2:] + color3[2:]
    return ans
def draw(model, l, df):
'''
绘制图像直观显示结果
'''
x_list, y_list = [0 for i in range(l)], [0 for i in range(l)]
for v in model.variables():
if 'BerthLocation' in v.name:
x_list[int(v.name[-1])] = v.varValue
if 'BerthTime' in v.name:
y_list[int(v.name[-1])] = v.varValue
print('BerthLocation:', x_list)
print('BerthTime:', y_list)
plt.figure()
for i in range(l):
color = getColor()
rect = plt.Rectangle(
(x_list[i], y_list[i]),
df.iloc[i, 5],
df.iloc[i, 3],
color=color,
fill=False,
)
plt.gca().add_patch(rect)
plt.scatter(
df.iloc[i, 1], df.iloc[i, 4], color=color
)
plt.title(f'BerthAllocation of {l} vessels')
plt.legend(['vessel', 'best location and required departure time'])
plt.grid(True)
plt.axis('auto')
plt.xlabel('Berths')
plt.ylabel('Date')
plt.show()
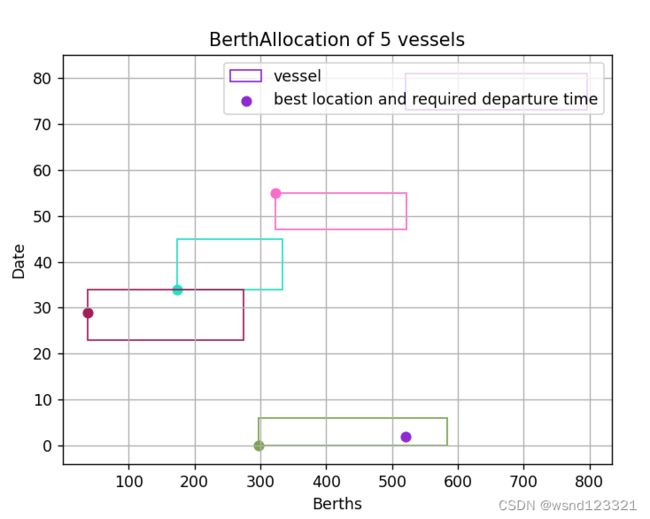
- 生成图像展示
- 五辆船舶时有最优解
- 输出结果
--------------------船舶数量为5--------------------
参数列表:
   vessel  p_i  a_i  b_i  d_i  l_i  c_{1i}  c_{2i}
0       0  520   73    8    2  276       5       9
1       1  323   21    8   55  199       9       9
2       2  297    0    6    0  287       5       5
3       3  174   13   11   34  159       5       5
4       4   38   23   11   29  236       5       7
求解状态: Optimal
BerthLocation: [520.0, 323.0, 297.0, 174.0, 38.0]
BerthTime: [73.0, 47.0, 0.0, 34.0, 23.0]
- 结果图像
- 25辆船时无解
--------------------船舶数量为25--------------------
参数列表:
    vessel  p_i  a_i  b_i  d_i  l_i  c_{1i}  c_{2i}
0        0  535   11   11   87  198       8       6
1        1  537   73    7   68  278       6       5
2        2  103    7    8   34  171       5       7
3        3   19   17    7   33  199       5       5
4        4  138   64    7   21  208       5       9
5        5  455   74   10   54  198       8       6
6        6  543   45    9    7  247       9       7
7        7  479   33    9   71  268       9       8
8        8  176   20    8   40  284       8       8
9        9  364   59    8  100  179       7       9
10      10  367   29   10   56  275       7       6
11      11  280   39    8   88  286       9       7
12      12  411   63    8   38  280       9       7
13      13  475   71   11   96  205       8       9
14      14  154   29    6   88  174       7       8
15      15   98    8   11   78  258       7       9
16      16  100   62    9   64  238       7       5
17      17  303   45    9   97  265       6       6
18      18  407   50    9   34  232       9       7
19      19  113   55    6   75  286       7       7
20      20  538    3   10   99  176       5       7
21      21  309   46    8   72  223       9       7
22      22  358   26   11   22  208       8       5
23      23  456   61    9   63  172       6       7
24      24   33   11    8   69  259       5       8
求解状态: Infeasible
完整代码
import random
import pulp
import pandas as pd
import matplotlib.pyplot as plt
L = 900
M = 9999999
def createPara(l):
'''
用df存储随机生成的参数
Args:
l (int): number of vessels
Returns:
dataframe: 参数表格
'''
df = pd.DataFrame()
df['vessel'] = list(range(l))
df['p_i'] = [
random.randint(0, 550) for i in range(l)
]
df['a_i'] = [
random.randint(0, 75) for i in range(l)
]
df['b_i'] = [
random.randint(6, 11) for i in range(l)
]
df['d_i'] = [
random.randint(0, 100) for i in range(l)
]
df['l_i'] = [random.randint(150, 300) for i in range(l)]
df['c_{1i}'] = [
random.randint(5, 9) for i in range(l)
]
df['c_{2i}'] = [random.randint(5, 9) for i in range(l)]
return df
def createVar(l):
'''
创建变量
Args:
l (int): number of vessels
Returns:
list: 每个列表存储不同种类的变量
'''
x_variables = ['x_' + str(i) for i in range(l)]
y_variables = ['y_' + str(i) for i in range(l)]
zx_variables = [
[f'zx_{i}{j}' for j in range(l)] for i in range(l)
]
zy_variables = [
[f'zy_{i}{j}' for j in range(l)] for i in range(l)
]
abs_variables = [
f'abs_{i}' for i in range(l)
]
return x_variables, y_variables, zx_variables, zy_variables, abs_variables
def createPulpVar(x_variables, y_variables, zx_variables, zy_variables, abs_variables):
'''
将变量转换为pulp变量
直接创建变量是不能用在pulp中的, 需要将变量转换为pulp的变量, 在目标函数和约束条件中必须使用pulp变量
Args:
x_variables (lsit): berth location
y_variables (list): berthing time
zx_variables (list): if vessel i located to the left_hand of vessel j
zy_variables (list): if vessel i located below vessel j
abs_variables (list): a variable to replace the absolute value
'''
BerthLocation = pulp.LpVariable.dicts(
'BerthLocation', x_variables, lowBound=0, cat='Integer'
)
BerthTime = pulp.LpVariable.dicts(
'BerthTime', y_variables, lowBound=0, cat='Integer'
)
LeftSide = pulp.LpVariable.dicts(
'LeftSide',
[item for row in zx_variables for item in row],
lowBound=0,
cat='Binary',
)
Below = pulp.LpVariable.dicts(
'Below',
[item for row in zy_variables for item in row],
lowBound=0,
cat='Binary',
)
Abs = pulp.LpVariable.dicts(
'Abs', abs_variables, lowBound=0, cat='Integer'
)
return BerthLocation, BerthTime, LeftSide, Below, Abs
def getColor():
'''
生成随机颜色以上色
'''
color1 = random.randint(16, 255)
color2 = random.randint(16, 255)
color3 = random.randint(16, 255)
color1 = hex(color1)
color2 = hex(color2)
color3 = hex(color3)
ans = "#" + color1[2:] + color2[2:] + color3[2:]
return ans
def draw(model, l, df):
'''
绘制图像直观显示结果
'''
x_list, y_list = [0 for i in range(l)], [0 for i in range(l)]
for v in model.variables():
if 'BerthLocation' in v.name:
x_list[int(v.name[-1])] = v.varValue
if 'BerthTime' in v.name:
y_list[int(v.name[-1])] = v.varValue
print('BerthLocation:', x_list)
print('BerthTime:', y_list)
plt.figure()
for i in range(l):
color = getColor()
rect = plt.Rectangle(
(x_list[i], y_list[i]),
df.iloc[i, 5],
df.iloc[i, 3],
color=color,
fill=False,
)
plt.gca().add_patch(rect)
plt.scatter(
df.iloc[i, 1], df.iloc[i, 4], color=color
)
plt.title(f'BerthAllocation of {l} vessels')
plt.legend(['vessel', 'best location and required departure time'])
plt.grid(True)
plt.axis('auto')
plt.xlabel('Berths')
plt.ylabel('Date')
plt.show()
def main(l):
'''
线性规划模型
Args:
l (int): number of vessels
'''
model = pulp.LpProblem('BerthAllocation', pulp.LpMinimize)
df = createPara(l)
print('参数列表:')
print(df)
x_variables, y_variables, zx_variables, zy_variables, abs_variables = createVar(
l
)
BerthLocation, BerthTime, LeftSide, Below, Abs = createPulpVar(
x_variables, y_variables, zx_variables, zy_variables, abs_variables
)
model += pulp.lpSum(
[
df.iloc[i, 6]
* (Abs[abs_variables[i]])
+ df.iloc[i, 7]
* (BerthTime[y_variables[i]] + df.iloc[i, 3] - df.iloc[i, 4])
for i in range(l)
]
)
for i in range(l):
model += (
Abs[abs_variables[i]] >= BerthLocation[x_variables[i]] - df.iloc[i, 1]
)
model += (
Abs[abs_variables[i]] >= -BerthLocation[x_variables[i]] + df.iloc[i, 1]
)
model += BerthLocation[x_variables[i]] + df.iloc[i, 5] <= L
model += BerthTime[y_variables[i]] >= df.iloc[i, 2]
model += (
BerthTime[y_variables[i]] + df.iloc[i, 3] - df.iloc[i, 4] >= 0
)
for j in range(l):
if i < j:
model += (
LeftSide[zx_variables[i][j]]
+ Below[zy_variables[i][j]]
+ LeftSide[zx_variables[j][i]]
+ Below[zy_variables[j][i]]
>= 1
)
if i != j:
model += (
BerthLocation[x_variables[i]] + df.iloc[i, 5]
<= BerthLocation[x_variables[j]]
+ (1 - LeftSide[zx_variables[i][j]]) * M
)
model += (
BerthTime[y_variables[i]] + df.iloc[i, 3]
<= BerthTime[y_variables[j]] + (1 - Below[zy_variables[i][j]]) * M
)
model.solve(
pulp.apis.PULP_CBC_CMD(msg=False)
)
print(
"求解状态:", pulp.LpStatus[model.status]
)
if pulp.LpStatus[model.status] == 'Optimal':
draw(model, l, df)
print("最优总成本 = ", pulp.value(model.objective))
if __name__ == '__main__':
for number in range(5, 30, 5):
print(f'--------------------船舶数量为{number}--------------------')
main(number)
题外话
- 帮学弟做的一门课程的大作业, 我自认为做的不错, 然而他老师给他大作业打了 0 分, 不知道什么原因, 可能是因为他老师调研过班里并没有人会 python, 觉得第一次用 python 不可能写成这样? 还是确实哪里做错了, 请大家指正.