GEEer成长日记四:Landsat8_SR计算NDVI并时间序列分析
前两次我们介绍了MODIS_NDVI和LANDSAT8_NDVI产品的时间序列,它们都是基于Landsat8_TOA影像制成的。实际工作中我们还需要通过LANDSAT8_SR影像进行NDVI时间序列分析,那么该怎么开展工作呢?本期我们就来介绍介绍。
下一期我们将介绍Sentinel-2数据在时间序列方面的研究。
LANDSAT/LC08/C01/T1_SR (deprecated)
如果想深入了解这两个数据集,可以登录:
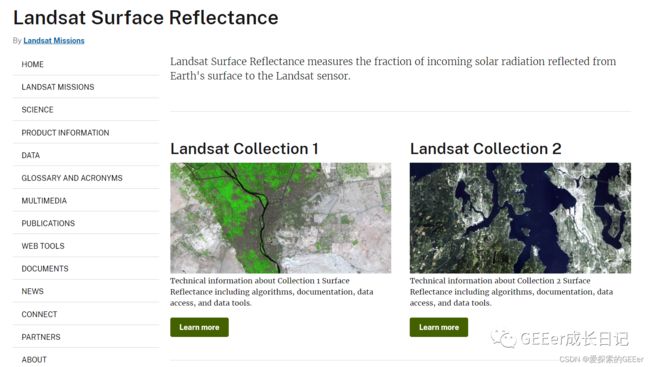
Landsat Surface Reflectance | U.S. Geological Survey
官方介绍:This dataset is the atmospherically corrected surface reflectance from the Landsat 8 OLI/TIRS sensors. These images contain 5 visible and near-infrared (VNIR) bands and 2 short-wave infrared (SWIR) bands processed to orthorectified surface reflectance, and two thermal infrared (TIR) bands processed to orthorectified brightness temperature
These data have been atmospherically corrected using LaSRC and includes a cloud, shadow, water and snow mask produced using CFMASK, as well as a per-pixel saturation mask.
Strips of collected data are packaged into overlapping "scenes" covering approximately 170km x 183km using a standardized reference grid.
See also the USGS page on SR QA bands.
SR can only be produced for Landsat assets processed to the L1TP level
Data provider notes:
-
Although Surface Reflectance can be processed only from the Operational Land Imager (OLI) bands, SR requires combined OLI/Thermal Infrared Sensor (TIRS) product (LC8) input in order to generate the accompanying cloud mask. Therefore, OLI only (LO8), and TIRS only (LT8) data products cannot be calculated to SR.
-
SR is not run for a scene with a solar zenith angle greater than 76°.
-
Users are cautioned to avoid using SR for data acquired over high latitudes (> 65°).
-
The panchromatic band (ETM+ Band 7, OLI Band 8) is not processed to Surface Reflectance.
-
Efficacy of SR correction will be likely reduced in areas where atmospheric correction is affected by adverse conditions:
-
Hyper-arid or snow-covered regions
-
Low sun angle conditions
-
Coastal regions where land area is small relative to adjacent water
-
Areas with extensive cloud contamination
-
This product is generated by Google using a Docker image supplied by USGS.
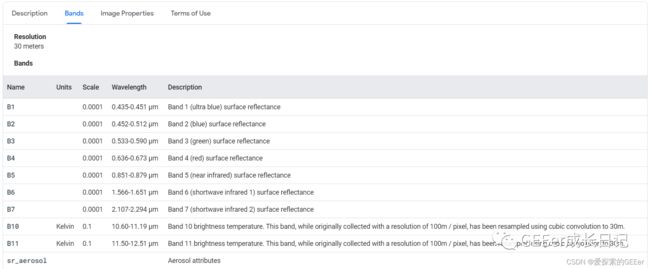
分辨率:30m
波段介绍:
首先在计算NDVI之前,我们先了解几种NDVI计算的方式,感谢大佬的总结(https://blog.csdn.net/weixin_43360896/article/details/108344915)。我就直接搬用了。
//方法一:普通方式,通过将数学公式翻译为代码直接计算
function NDVI_V1(img) {
 var nir = img.select("B5");
 var red = img.select("B4");
 var ndvi = nir.subtract(red).divide(nir.add(red));
 return ndvi;
}

//方法二:将计算公式直接带入,通过解析字符串实现计算。这种方式更加灵活,在某些特殊情况下非常好用,而且非常直观。
//在这里多插一嘴,这个img.expression在复杂公式计算的时候,可谓真香!屡试不爽
function NDVI_V2(img) {
 var nir = img.select("B5");
 var red = img.select("B4");
 var ndvi = img.expression(
   "(B5 - B4)/(B5 + B4)",
   {
     "B5": nir,
     "B4": red
   });
 return ndvi;
}

//方法三:GEE将计算公式封装为一个方法可以直接调用
function NDVI_V3(img) {
 var ndvi = img.normalizedDifference(["B5","B4"]);
 return ndvi;
}
好了,介绍完几种NDVI的计算方法后,我们使用第三种方法开始进行时间序列分析。
//还是老样子哈,以广东省2020年为目标
var geometry = ee.FeatureCollection('users/ZhengkunWang/guangdongsheng')
Map.centerObject(geometry,6)

var colorizedVis = {
  min: -0.8,
  max: 0.8,
  palette: ['blue', 'white', 'green'],
};
//去云的方法照搬就可以,想深入了解的同学可以去看看波段介绍
//cloud mask
function maskL8sr(image) {
  // Bits 3 and 5 are cloud shadow and cloud, respectively.
  var cloudShadowBitMask = (1 << 3);
  var cloudsBitMask = (1 << 5);
  // Get the pixel QA band.
  var qa = image.select('pixel_qa');
  // Both flags should be set to zero, indicating clear conditions.
  var mask = qa.bitwiseAnd(cloudShadowBitMask).eq(0)
                 .and(qa.bitwiseAnd(cloudsBitMask).eq(0));
  return image.updateMask(mask);
}

var col = ee.ImageCollection('LANDSAT/LC08/C01/T1_SR')
.map(maskL8sr)
.filterDate('2020-01-01','2020-12-31')
.filterBounds(geometry)
.map(function(image){
  var ndvi = image.normalizedDifference(['B5', 'B4']).rename('NDVI');
  return image.addBands(ndvi)
})
.select('NDVI');

Map.addLayer(col.mean().clip(geometry), colorizedVis, 'col');
结果如图:

print(ui.Chart.image.series(col, geometry, ee.Reducer.mean(), 500));
结果如图:

其实看完时间序列,还是会发现,有好多异常值。对我们的研究来说肯定是不适用的。
我们先研究研究它的变化趋势吧。
var landsat8trendline = Chart.image.series(col, geometry, ee.Reducer.mean(), 500);
landsat8trendline = landsat8trendline
    .setOptions({
        title: 'Landsat 8 SR NDVI',
        hAxis: {title: 'Date', gridlines: {count: 10}},
        vAxis: {title: 'NDVI',viewWindowMode: 'explicit', viewWindow: {max: 1,min: -0.25,},gridlines: {count: 5,}},
        interpolateNulls: true,
        lineWidth: 1,
    pointSize: 1,
    trendlines: { 0: {title: 'NDVI_trend',type:'linear', showR2: true,  color:'red', visibleInLegend: true}}
    });
print(landsat8trendline)
这次我们在趋势线分析的时候,还加入了趋势线的相关系数R2进行分析,虽然结果0.033,但是看起来还算可以。强行接受
既然结果不太美观,我们在进行月平均分析一波吧。
var years = ee.List.sequence(2020, 2020);
var months = ee.List.sequence(1, 12);
var landsat8monthlymeanNDVI =  ee.ImageCollection.fromImages(
  years.map(function (y) {
    return months.map(function(m) {
    return col.filter(ee.Filter.calendarRange(y,y, 'year')).filter(ee.Filter.calendarRange(m, m, 'month')).mean().set('year', y).set('month', m).set('system:time_start', ee.Date.fromYMD(y, m, 1));
    });
  }).flatten()
);
print(ui.Chart.image.series(landsat8monthlymeanNDVI, geometry, ee.Reducer.mean(), 500));
稍微平滑了一点点吧算是。再加入趋势线看看相关系数
var monthlymeantrendline = Chart.image.series(landsat8monthlymeanNDVI, geometry, ee.Reducer.mean(), 500);
monthlymeantrendline = monthlymeantrendline
    .setOptions({
        title: 'Landsat 8 SR NDVI',
        hAxis: {title: 'Date', gridlines: {count: 10}},
        vAxis: {title: 'NDVI',viewWindowMode: 'explicit', viewWindow: {max: 1,min: -0.25,},gridlines: {count: 5,}},
        interpolateNulls: true,
        lineWidth: 1,
    pointSize: 1,
    trendlines: { 0: {title: 'NDVI_trend',type:'linear', showR2: true,  color:'red', visibleInLegend: true}}
    });
print(monthlymeantrendline)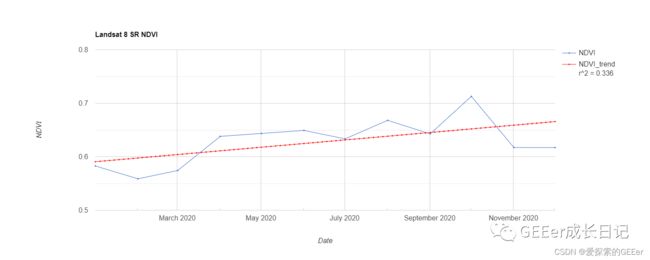
哈哈,相关系数翻了10倍。其实趋势没有变,只是月平均NDVI更加平滑罢了。不过月平均分析还是挺管用的。
更多精彩内容请关注: