html多图自动展示,基于echarts+html+css+jq的数据可视化大屏展示炫酷看板
默认你已经具备前端基础 html,css,js,jq这些基本知识都已经掌握。
什么是echarts?
ECharts,一个使用 JavaScript 实现的开源可视化库,可以流畅的运行在 PC 和移动设备上,兼容当前绝大部分浏览器(IE8/9/10/11,Chrome,Firefox,Safari等),底层依赖矢量图形库 ZRender,提供直观,交互丰富,可高度个性化定制的数据可视化图表。
类似于echarts的图表库还有Highcharts,G2,d3等,至于项目怎么选型图表库,大可不用为这事情纠结,就像支付宝和微信都有支付,平时买东西你会选择使用哪个付款就是看个人操作习性了,个人还是比较倾向于echarts和G2,。
项目目录
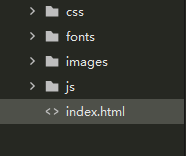
实现方式
index.html文件:项目的核心文件,部分示例代码如下:
数据看板css文件包:顾名思义里面放置的是页面的样式,这个样式主要是多页面的整体性的框架,以及布局的样式约束,另外此项目就涉及一张页面大屏展示,自适应适配方式采用的rem+flex的布局当时进行的适配,部分代码示例如下:
整张页面的样式都丢在index.css
~~~css
body {
line-height: 1.15;
font-size: 0.16rem;
margin: 0;
padding: 0;
background-repeat: no-repeat;
background-position: 0 0 / cover;
background-color: #101129;
}
* {
margin: 0;
padding: 0;
font-weight: normal;
}
ul {
list-style: none;
}
a {
text-decoration: none;
}
.viewport {
min-width: 1024px;
max-width: 1920px;
margin: 0 auto;
display: flex;
padding: 0.05rem 0.15rem 0;
}
.chart {
width: 600px;
height:500px;
}
....
js文件包的index.js文件,部分代码示例如下:
//图表的tooltip自动定时滚动显示函数
function autoTip(total, index, myechart) {
timer = setInterval(function() {
myechart.dispatchAction({
type: 'showTip',
seriesIndex: '0',
dataIndex: index
});
index += 1;
if (index > total) {
index = 0;
}
}, 1000);
}
(function() {
// 基于准备好的dom,初始化echarts实例
var myechart = echarts.init(document.getElementById("chart"));
var fontColor = '#4c9bfd';
option = {
color: ['#02cdff', '#0090ff', '#f9e264'],
textStyle: {
fontSize: 10
},
grid: {
left: '0',
right: '3%',
bottom: '3%',
top: '18%',
containLabel: true,
show: true,
borderColor: 'rgba(0, 240, 255, 0.3)'
},
tooltip: {
trigger: 'axis',
axisPointer: {
type: 'shadow',
label: {
show: true,
backgroundColor: '#333'
}
}
},
legend: {
show: true,
x: 'center',
top: '0',
textStyle: {
color: fontColor
},
data: ['录制', '直播', '巡课']
},
xAxis: [{
type: 'category',
boundaryGap: false,
axisTick: {
alignWithLabel: false,
show: false
},
axisLabel: {
color: '#4c9bfd'
},
data: ['5.11', '5.12', '5.13', '5.14', '5.15']
}],
yAxis: [{
type: 'value',
name: '次数',
nameTextStyle: {
color: "#ffffff",
fontSize: 10
},
axisLabel: {
color: '#4c9bfd'
},
splitLine: {
lineStyle: {
color: 'rgba(0, 240, 255, 0.3)'
}
},
}],
series: [{
name: '录制',
type: 'line',
stack: '总量',
symbolSize: 5,
label: {
normal: {
show: true,
position: 'top'
}
},
itemStyle: {
normal: {
areaStyle: {
//color: '#94C9EC'
color: new echarts.graphic.LinearGradient(0, 1, 0, 0, [{
offset: 0,
color: 'rgba(7,46,101,0.3)'
}, {
offset: 1,
color: 'rgba(0,166,246,0.9)'
}]),
}
}
},
data: [120, 132, 101, 134, 90]
},
{
name: '直播',
type: 'line',
stack: '总量',
symbol: 'circle',
symbolSize: 5,
label: {
normal: {
show: true,
position: 'top'
}
},
itemStyle: {
normal: {
areaStyle: {
//color: '#94C9EC'
color: new echarts.graphic.LinearGradient(0, 1, 0, 0, [{
offset: 0,
color: 'rgba(7,44,90,0.3)'
}, {
offset: 1,
color: 'rgba(0,212,199,0.9)'
}]),
}
}
},
data: [220, 85, 191, 90, 230]
},
{
name: '巡课',
type: 'line',
stack: '总量',
symbol: 'circle',
symbolSize: 5,
label: {
normal: {
show: true,
position: 'top'
}
},
itemStyle: {
normal: {
areaStyle: {
//color: '#94C9EC'
color: new echarts.graphic.LinearGradient(0, 1, 0, 0, [{
offset: 0,
color: 'rgba(7,44,90,0.3)'
}, {
offset: 1,
color: 'rgba(0,212,199,0.9)'
}]),
}
}
},
data: [150, 232, 201, 154, 190]
}
]
};
myechart.setOption(option);
window.addEventListener("resize", function() {
myechart.resize();
});
var total = option.xAxis[0].data.length;
var index = 0;
autoTip(total, index, myechart)
})();
fonts文件包:这里面主要还是一些扁平化的icon,以及纯数字电子字体的字体包
需要一些图标的话可以在阿里矢量图标库,字体的话可以找一些开源的字体包。
images文件包:里面存放一些页面内所需要的图片以及科技感的边框等
=至此项目包的整体就组建好了,经过以上demo示例代码的组合,整个项目的冰山一角效果也就出来了,运行效果如下图:=

整个项目运行图展示:

以上内容如有错误地方还请留言/私信交流