传统机器学习(三)聚类算法K-means(一)
传统机器学习(三)聚类算法K-means(一)
一、聚类算法K-means初识
1.1 算法概述
K-Means算法是无监督的聚类算法,它实现起来比较简单,聚类效果也不错,因此应用很广泛。K-Means基于欧式距离认为两个目标距离越近,相似度越大。
1.1.1 算法流程
(1)图a表达了初始的数据集, 假设k=2;
(2)在图b中,随机选择两个k类的对应的类别质心,即图中的红色质心和蓝色质心,然后分别求样本中所有点到这两个质心的距离,并标记每个样本的类别为和该样本距离最小的质心的类别;
(3)如图c所示,经过计算样本和红色质心和蓝色质心的距离,得到所有样本点的第一轮迭代后的类别。
(4)如图d所示,对我们当前标记为红色和蓝色的点分别求其新的质心,新的红色质心和蓝色质心的位置已经发生了变动;
(5)图e和f重复了图c和d的过程,即将所有点的类别标记为距离最近的质心的类别并求新的质心。最终得到的两个类别如图f。
在实际k-means算法中,一般会多次运行图c和图d,才能达到最终的比较优的类别。
1.1.2 k-means聚类算法步骤
k-means聚类算法步骤实质是EM算法的模型优化过程,具体步骤如下:
1)随机选择k个样本作为初始簇类的均值向量;
2)将每个样本数据集划分离它距离最近的簇;
3)根据每个样本所属的簇,更新簇类的均值向量;
4)重复(2)(3)步,当达到设置的迭代次数或簇类的均值向量不再改变时,模型构建完成,输出聚类算法结果。
1.1.3 K-Means优缺点
优点:
(1)原理比较简单,容易实现,收敛速度快
(2)算法的可解释度比较强,复杂度低
(3)聚类效果较优
(4)主要需要调参数是簇数k
缺点:
(1)k值难确定
(2)复杂度与样本呈线性关系,不是凸的数据集比较难收敛
(3)很难发现任意形状的簇
(4)采用迭代方法,得到的结果只是局部最优
(5)对噪音和异常点比较敏感
1.2 K-means代码手动实现
1.2.1 代码手动实现
import numpy as np

class KMeans:
    def __init__(self,data,num_clusters):
        self.data = data
        self.num_clusters = num_clusters

    def train(self,max_epochs):
        """
          训练
        :param max_epochs: 迭代次数
        :return: centre_points 迭代后的质心
                 examples_idx_to_clusters 每一个样本索引所属的簇
        """
        # 1、随机寻找num_clusters个中心点作为质心
        centre_points = KMeans.centre_points_init(self.data,self.num_clusters)
        # 2、开始训练
        num_examples = self.data.shape[0]
        examples_idx_to_clusters = np.empty((num_examples,1))
        for _ in range(max_epochs):
            # 3、每一次迭代中,得到当前每一个样本距离各个簇中心的距离,并且找到距离最近簇
            examples_idx_to_clusters = KMeans.find_examples_closest_cluster(self.data,centre_points)
            # 4、更新簇的质心
            centre_points = KMeans.clusters_update(self.data,examples_idx_to_clusters,self.num_clusters)
        return centre_points,examples_idx_to_clusters


    @staticmethod
    def centre_points_init(data,num_clusters):
        """
            随机初始化num_clusters个质心
        :param data: 训练数据
        :param num_clusters: 簇的数量
        :return:
        """
        # 1、训练样本的数量
        num_examples = data.shape[0]
        # 2、得到洗牌后的索引
        random_idx = np.random.permutation(num_examples)
        # 3、将前num_clusters个数据作为中心点
        centre_points = data[random_idx[:num_clusters], :]
        return centre_points

    @staticmethod
    def find_examples_closest_cluster(data, centre_points):
        """
           计算每一个样本距离簇中心的距离,并找到距离最近的簇
        :param data: 样本
        :param centre_points: 当前的簇中心
        :return:
        """
        # 1、训练样本的数量以及簇的数量
        num_examples = data.shape[0]
        num_centre_points = centre_points.shape[0]

        # 2、初始化
        examples_idx_to_clusters = np.zeros((num_examples,1))
        # 3、遍历每一个样本,计算每一个样本距离每一个簇中心的距离
        # 遍历每一个样本索引
        for example_idx in range(num_examples):
            distance = np.zeros((num_centre_points,1))
            # 遍历每一个簇中心的索引,计算当前样本距离每一个簇中心的距离
            for centre_point_idx in range(num_centre_points):
                distance_diff = data[example_idx, :] - centre_points[centre_point_idx, :]
                distance[centre_point_idx] = np.sum(distance_diff**2)
            # 找出距离最近的簇
            examples_idx_to_clusters[example_idx] = np.argmin(distance)

        return examples_idx_to_clusters

    @staticmethod
    def clusters_update(data, examples_idx_to_clusters,num_clusters):
        """
           更新每一个簇的质心
        :param data: 训练样本
        :param examples_idx_to_clusters: 每一个样本(索引)所属的簇
        :return:
        """
        # 1、初始化新的质心
        num_features = data.shape[1]
        centre_points = np.zeros((num_clusters, num_features))

        # 2、遍历当前每一个质心,从examples_idx_to_clusters中获取等于当前质心索引的数据,然后计算新的质心(均值)
        for centre_point_idx in range(num_clusters):
            closest_ids = examples_idx_to_clusters == centre_point_idx
            centre_points[centre_point_idx] = np.mean(data[closest_ids.flatten(), :],axis=0)

        return centre_points
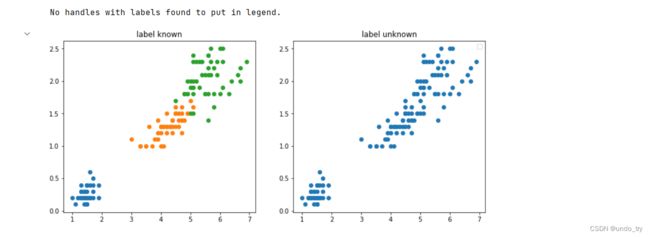
1.2.2 鸢尾花数据集上测试验证
import numpy as np
import pandas as pd
# 导入画图模块
import matplotlib.pyplot as plt
%matplotlib inline
# 1、读取鸢尾花数据集
data = pd.read_csv('./data/iris.csv')

iris_types = ['SETOSA','VERSICOLOR','VIRGINICA']
x_axis = 'petal_length'
y_axis = 'petal_width'

data.head()
# 2、绘制图形
plt.figure(figsize=(12,5))
# 2.1 绘制有标签数据集的数据分布
plt.subplot(1,2,1)
for iris_type in iris_types:
    plt.scatter(data[x_axis][data['class']==iris_type],data[y_axis][data['class']==iris_type],label = iris_type)
plt.title('label known')

# 2.1 绘制没有标签数据集分布(无监督)
plt.subplot(1,2,2)
plt.scatter(data[x_axis][:],data[y_axis][:])
plt.title('label unknown')
plt.legend()
plt.show()
from k_means import KMeans
# 3、导入KMeans训练,得到质心以及每个样本(索引)所属的簇
num_examples = data.shape[0]
x_train = data[[x_axis,y_axis]].values.reshape(num_examples,2)

# 指定好训练所需的参数
num_clusters = 3
max_epochs = 50

k_means = KMeans(x_train,num_clusters)
centre_points,examples_idx_to_clusters = k_means.train(max_epochs)
centre_points
# 4、画图进行对比
plt.figure(figsize=(12,5))

# 绘制现有数据集的分布
plt.subplot(1,2,1)
for index,iris_type in enumerate(iris_types):
    plt.scatter(data[x_axis][data['class']==iris_type],data[y_axis][data['class']==iris_type],label= iris_type)
plt.title("label known")
plt.legend()

# 绘制训练后分好簇样本的分布情况
plt.subplot(1,2,2)
for centre_point_idx,centre_point in enumerate(centre_points):
    # 样本中属于当前质心的索引
    current_centre_point_examples_idx = examples_idx_to_clusters == centre_point_idx
    plt.scatter(data[x_axis][current_centre_point_examples_idx.flatten()],
                data[y_axis][current_centre_point_examples_idx.flatten()],
                label=centre_point_idx)

# 质心画图
for centre_point_idx,centre_point in enumerate(centre_points):
    plt.scatter(centre_point[0],
                centre_point[1],
                c='red',
                marker='x')
plt.legend()
plt.title("label kmeans")
plt.show()
1.3 sklearn工具包中的Kmeans
1.3.1 利用sklearn中的make_blobs方法产生聚类数据集
make_blobs函数是为聚类产生数据集,产生一个数据集和相应的标签
sklearn.datasets.make_blobs(n_samples=100,n_features=2,centers=3, cluster_std=1.0,center_box=(-10.0,10.0),shuffle=True,random_state=None)
-
n_samples:表示数据样本点个数,默认值100
-
n_features:是每个样本的特征(或属性)数,也表示数据的维度,默认值是2
-
centers:表示类别数(标签的种类数),默认值3
-
cluster_std表示每个类别的方差,例如我们希望生成2类数据,其中一类比另一类具有更大的方差,可以将cluster_std设置为[1.0,3.0],浮点数或者浮点数序列,默认值1.0
-
center_box:中心确定之后的数据边界,默认值(-10.0, 10.0)
-
shuffle :将数据进行洗乱,默认值是True
-
random_state:官网解释是随机生成器的种子,可以固定生成的数据,给定数之后,每次生成的数据集就是固定的。若不给定值,则由于随机性将导致每次运行程序所获得的的结果可能有所不同。在使用数据生成器练习机器学习算法练习或python练习时建议给定数值。
利用此函数,产生聚类数据集
import numpy as np
import os
%matplotlib inline
import matplotlib
import matplotlib.pyplot as plt
plt.rcParams['axes.labelsize'] = 14
plt.rcParams['xtick.labelsize'] = 12
plt.rcParams['ytick.labelsize'] = 12
import warnings
warnings.filterwarnings('ignore')
np.random.seed(42)
# 导入make_blobs函数
from sklearn.datasets import make_blobs

# 指定每个簇的质心
blob_centers = np.array(
    [
     [0.2,2.3],
     [-1.5,2.3],
     [-2.8,1.8],
     [-2.8,2.8],
     [-2.8,1.3]
    ]
)

# 指定每个簇的方差
blob_std =np.array([0.4,0.3,0.1,0.1,0.1])

# 构造聚类数据集(X是2个特征的样本数据(2000个样本),y是属于哪个簇)
X,y = make_blobs(n_samples=2000,centers=blob_centers,cluster_std=blob_std,random_state=7)

# 将构造的数据集绘制图像
plt.figure(figsize=(10,5))
plt.scatter(X[:,0],X[:,1],s=1)
plt.xlabel("x_1", fontsize=14)
plt.ylabel("x_2", fontsize=14)
plt.show()
1.3.2 sklearn中的Kmeans算法
KMeans(n_clusters=8, init='k-means++', n_init=10, max_iter=300, tol=0.0001,
         precompute_distances='auto', verbose=0, random_state=None,
         copy_x=True, n_jobs=None, algorithm='auto')
1.n_clusters: 分类簇的数量。
2.init: 接收待定的string。kmeans++表示该初始化策略选择的初始均值向量之间都距离比较远,它的效果较好;random表示从数据中随机选择K个样本最为初始均值向量;或者提供一个数组,数组的形状为(n_cluster,n_features),该数组作为初始均值向量。
3.n_init: 用不同的聚类中心初始化值运行算法的次数,最终解是在inertia意义下选出的最优结果;默认值为10。
4.max_iter: 最大的迭代次数。
5.tol: 表示算法收敛的阈值。
6.precompute_distance: 接收Boolean或者auto。表示是否提前计算好样本之间的距离,auto表示如果nsamples*n>12 million,则不提前计算。
7.verbose: 0表示不输出日志信息;1表示每隔一段时间打印一次日志信息。如果大于1,打印次数频繁。
8.random_state: 表示随机数生成器的种子。
9.n_jobs: 表示任务使用CPU数量;若值为 -1,则用所有的CPU进行运算。
from sklearn.cluster import KMeans

# 初始化
kmeans = KMeans(n_clusters=5,random_state=42)

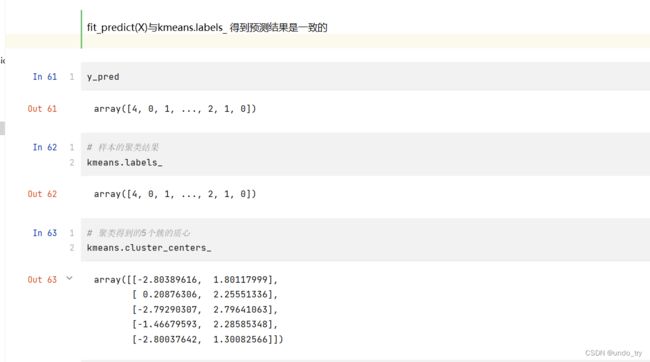
# fit_predict(X)与kmeans.labels_ 得到预测结果是一致的
y_pred =  kmeans.fit_predict(X)
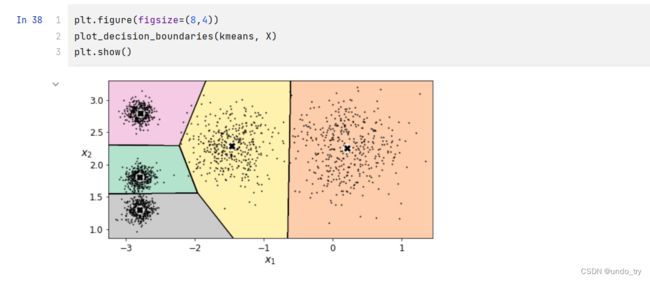
绘制决策边界
def plot_data(X):
    plt.plot(X[:, 0], X[:, 1], 'k.', markersize=2)
# 绘制质心
def plot_centroids(centroids, weights=None, circle_color='w', cross_color='k'):
    if weights is not None:
        centroids = centroids[weights > weights.max() / 10]
    plt.scatter(centroids[:, 0], centroids[:, 1],
                marker='o', s=5, linewidths=10,
                color=circle_color, zorder=10, alpha=0.9)
    plt.scatter(centroids[:, 0], centroids[:, 1],
                marker='x', s=5, linewidths=10,
                color=cross_color, zorder=11, alpha=1)
# 绘制决策边界
def plot_decision_boundaries(clusterer, X, resolution=1000, show_centroids=True,
                             show_xlabels=True, show_ylabels=True):
    mins = X.min(axis=0) - 0.1
    maxs = X.max(axis=0) + 0.1
    xx, yy = np.meshgrid(np.linspace(mins[0], maxs[0], resolution),
                         np.linspace(mins[1], maxs[1], resolution))
    Z = clusterer.predict(np.c_[xx.ravel(), yy.ravel()])
    Z = Z.reshape(xx.shape)

    plt.contourf(Z, extent=(mins[0], maxs[0], mins[1], maxs[1]),
                cmap="Pastel2")
    plt.contour(Z, extent=(mins[0], maxs[0], mins[1], maxs[1]),
                linewidths=1, colors='k')
    plot_data(X)
    if show_centroids:
        plot_centroids(clusterer.cluster_centers_)

    if show_xlabels:
        plt.xlabel("$x_1$", fontsize=14)
    else:
        plt.tick_params(labelbottom='off')
    if show_ylabels:
        plt.ylabel("$x_2$", fontsize=14, rotation=0)
    else:
        plt.tick_params(labelleft='off')
1.3.2.1 重要参数init、random_state、n_init
在K-Means中有一个重要的环节,就是放置初始质心。如果有足够的时间,K-means一定会收敛,但可能收敛到局部最小值。是否能够收敛到真正的最小值很大程度上取决于质心的初始化。init就是用来帮助我们决定初始化方式的参数。
-
初始质心放置的位置不同,聚类的结果很可能也会不一样,一个好的质心选择可以让K-Means避免更多的计算,让算法收敛稳定且更快。
在之前初始质心的放置时,我们是使用”随机“的方法在样本点中抽取k个样本作为初始质心,这种方法显然不符合”稳定且更快“的需求。为此,我们可以使用random_state参数来控制每次生成的初始质心都在相同位置,甚至可以画学习曲线来确定最优的random_state是哪个整数。 -
一个random_state对应一个质心随机初始化的随机数种子。如果不指定随机数种子,则sklearn中的K-means并不会只选择一个随机模式扔出结果,而会在每个随机数种子下运行多次,并使用结果最好的一个随机数种子来作为初始质心。
-
我们可以使用参数n_init来选择,每个随机数种子下运行的次数。这个参数不常用到,默认10次,如果我们希望运行的结果更加精确,那我们可以增加这个参数n_init的值来增加每个随机数种子下运行的次数。然而这种方法依然是基于随机性的。
1.3.2.2 迭代停止参数max_iter & tol
当质心不再移动,Kmeans算法就会停下来。但在完全收敛之前,我们也可以使用max_iter,最大迭代次数,或者tol,两次迭代间Inertia下降的量,这两个参数来让迭代提前停下来。
有时候,当我们的n_clusters选择不符合数据的自然分布,或者我们为了业务需求,必须要填入与数据的自然分布不合的n_clusters,提前让迭代停下来反而能够提升模型的表现。
-
max_iter:整数,默认300,单次运行的k-means算法的最大迭代次数
-
tol:浮点数,默认1e-4,两次迭代间Inertia下降的量,如果两次迭代之间Inertia下降的值小于tol所设定的值,迭代就会停下
1.3.2.3 重要属性及接口
重要属性
| 属性 | 含义 |
|---|---|
| cluster_centers_ | 收敛到的质心。如果算法在完全收敛之前就已经停下了 (受到参数max_iter和tol的控制),所返回的内容将与labels_ 属性中反应出来的聚类结果不一致。 |
| labels_ | 每个样本点对应的标签 |
| inertia_ | 每个样本点到距离他们最近的簇心的均方距离,又叫做"簇内平方和"。 |
| n_iter_ | 实际的迭代次数 |
重要接口
| 接口 | 输入 | 功能&返回 |
|---|---|---|
| fit | 训练特征矩阵X,[训练用标签,sample_weight] | 拟合模型,计算K均值的聚类结果 |
| fit_predict | 训练特征矩阵X,[训练用标签,sample_weight] | 计算质心并且为每个样本预测所在的簇的索引,功能相当于先fit再predict |
| fit_transform | 训练特征矩阵X,[训练用标签,sample_weight] | 返回新空间中的特征矩阵进行聚类并且将特征矩阵X转换到簇距离空间当中,功能相当于先fit再transform |
| get_params | 不需要任何输入 | 获取该类的参数 |
| predict | 测试特征矩阵X,[sample_weight] | 预测每个测试集X中的样本的所在簇,并返回每个样本所对应的族的索引午矢量量化的相关文献中,cluster centers 被称为代码簿,而predict返回的每个值是代码簿中最接近的代码的索引。 |
| score | 测试特征矩阵X,[训练用标签,sample_weight] | 返回聚类后的Inertia,即簇内平方和的负数族 |
| set_params | 需要新设定的参数 | 为建立好的类重设参数 |
| transform | 任意特征矩阵X | 将X转换到簇距离空间中。新空间中,每个维度(即每个坐标轴) 是样本点到集群中心的距离。 |
1.3.3 Kmeans聚类结果不稳定
# 结果的不稳定性
def plot_cluster_compare(c1,c2,X):
    c1.fit(X)
    c2.fit(X)

    plt.figure(figsize=(12,4))
    plt.subplot(121)
    plot_decision_boundaries(c1,X)
    plt.subplot(122)
    plot_decision_boundaries(c2,X)
# init='random'表示初始质心为随机选择,n_init=1表示运行算法的次数为1
c1 = KMeans(n_clusters=5,init='random',n_init=1,random_state=11)
c2 = KMeans(n_clusters=5,init='random',n_init=1,random_state=12)

# 可以看到初始质心的不同,最终得到的聚类结果也不同
plot_cluster_compare(c1,c2,X)
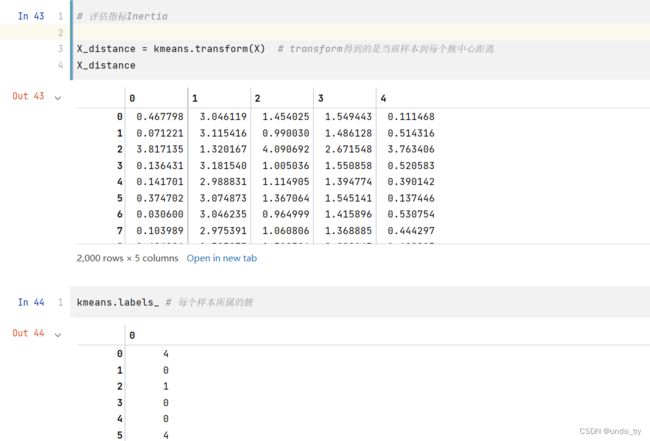
1.3.4 评估指标Inertia
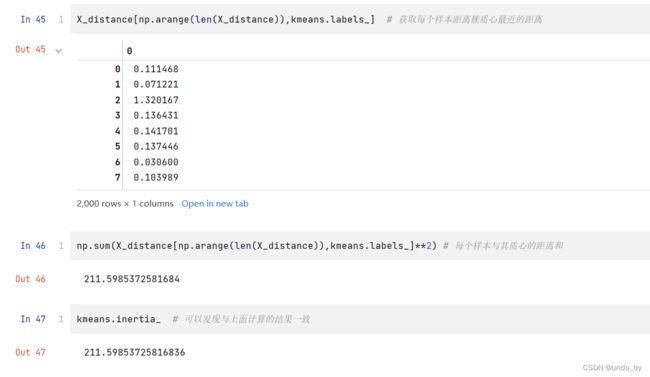
Inertia指标:每个样本与其最近质心的均方距离
1.3.5 如何找到合适的K值
核心思想:
-
随着k增大,样本划分会更加精细,每个簇的聚合程度逐渐提高,那么inertia会逐渐变小
-
当k小于真实聚类数时,k的增大会大幅增加每个簇的聚合程度,故inertia的下降幅度会很大,
而当k到达真实聚类数时,再增加k所得到的聚合程度回报会迅速变小,所以inertia的下降幅度会骤减,然后随着k值的继续增大而趋于平缓,也就是说inertia和k的关系图是一个手肘的形状,
而这个肘部对应的k值就是数据的真实聚类数;
# 对kmeans初始化多个k进行训练
kmeans_mul = [KMeans(n_clusters=k).fit(X) for k in range(1,10)]
# 得到不同k的评估指标inertia
inertias = [model.inertia_ for model in kmeans_mul]

# 对评估指标绘图
plt.figure(figsize=(8,4))
plt.plot(range(1,10),inertias,'ro-')
plt.axis([1,8.5,0,1300])
plt.show()
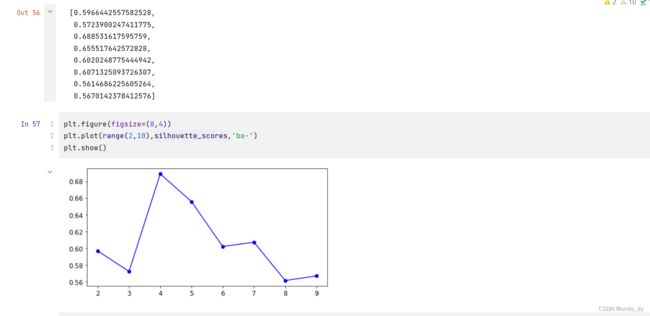
1.3.6 聚类算法评估指标—轮廓系数
在分类中,有直接结果(标签)的输出,并且分类的结果有正误之分,所以我们使用预测的准确度,混淆矩阵,ROC曲线等等指标来进行评估,但无论如何评估,都是在”模型找到正确答案“的能力。
而回归中,由于要拟合数据,我们有SSE均方误差,有损失函数来衡量模型的拟合程度。但这些衡量指标都不能够使用于聚类。
聚类模型的结果不是某种标签输出,并且聚类的结果是不确定的,其优劣由业务需求或者算法需求来决定,并且没有永远的正确答案。那我们如何衡量聚类的效果呢?
Inertia可以,但是这个指标的缺点和极限太大。所以使用Inertia作为评估指标,会让聚类算法在一些细长簇,环形簇,或者不规则形状的流形时表现不佳。
在99%的情况下,我们是对没有真实标签的数据进行探索,也就是对不知道真正答案的数据进行聚类。这样的聚类,是完全依赖于评价簇内的稠密程度(簇内差异小)和簇间的离散程度(簇外差异大)来评估聚类的效果。其中轮廓系数是最常用的聚类算法的评价指标
- ai: 计算样本i到同簇其他样本的平均距离ai。ai 越小,说明样本i越应该被聚类到该簇。将ai 称为样本i的簇内不相似度。
- bi: 计算样本i到其他某簇Cj 的所有样本的平均距离bij,称为样本i与簇Cj 的不相似度。定义为样本i的簇间不相似度
结论:
- si接近1,则说明样本i聚类合理;
- si接近-1,则说明样本i更应该分类到另外的簇;
- 若si 近似为0,则说明样本i在两个簇的边界上。

总之,轮廓系数越接近于1越好,负数则表示聚类效果非常差。
# 轮廓系数
from sklearn.metrics import silhouette_score
silhouette_score(X,kmeans.labels_)

0.655517642572828
silhouette_scores = [silhouette_score(X,model.labels_) for model in kmeans_mul[1:]]

silhouette_scores
但轮廓系数也有缺陷,它在凸型的类上表现会虚高,比如基于密度进行的聚类,或通过DBSCAN获得的聚类结果,如果使用轮廓系数来衡量,则会表现出比真实聚类效果更高的分数。
1.4 案例
1.4.1 图像分割小案例
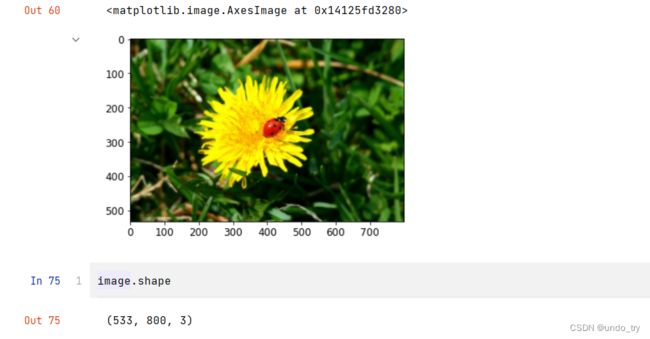
# 图像分割案例
from matplotlib.image import  imread


image = imread('./data/ladybug.png')
plt.imshow(image)
segmented_imgs = []
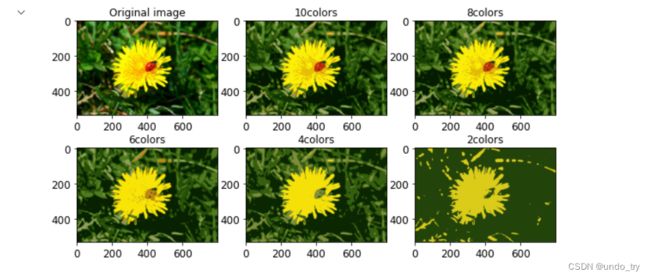
# 使用聚类方法,将色值分别聚成10,8,6,4,2类,并将每个色点赋值成聚类中心的颜色
n_colors = (10,8,6,4,2)
for n_cluster in n_colors:
    # 初始化并训练
    kmeans = KMeans(n_clusters = n_cluster,random_state=42).fit(X)
    # 将样本用聚合而成的簇中心进行表示
    segmented_img = kmeans.cluster_centers_[kmeans.labels_]
    segmented_imgs.append(segmented_img.reshape(image.shape))
# 绘制图像
plt.figure(figsize=(10,5))
plt.subplot(231)
plt.imshow(image)
plt.title('Original image')

for idx,n_clusters in enumerate(n_colors):
    plt.subplot(232+idx)
    plt.imshow(segmented_imgs[idx])
    plt.title('{}colors'.format(n_clusters))
1.4.2 聚类算法用于降维
K-Means聚类最重要的应用之一是非结构数据(图像,声音)上的矢量量化(VQ)。
非结构化数据往往占用比较多的储存空间,文件本身也会比较大,运算非常缓慢,我们希望能够在保证数据质量的前提下,尽量地缩小非结构化数据的大小,或者简化非结构化数据的结构。矢量量化就可以帮助我们实现这个目的。
KMeans聚类的矢量量化本质是一种降维运用。特征选择的降维是直接选取对模型贡献最大的特征,PCA的降维是聚合信息,而矢量量化的降维是在同等样本量上压缩信息的大小,即不改变特征的数目也不改变样本的数目,只改变在这些特征下的样本上的信息量。
上图是一组40个样本的数据,分别含有40组不同的信息(x1,x2)。我们将代表所有样本点聚成4类,找出四个质心,我们认为,这些点和他们所属的质心非常相似,因此他们所承载的信息就约等于他们所在的簇的质心所承载的信息。
于是,我们可以使用每个样本所在的簇的质心来覆盖原有的样本。这样,40个样本带有的40种取值,就被我们压缩了4组取值,虽然样本量还是40个,但是这40个样本的取值其实只有4个,就是分出来的四个簇的质心。用K-Means聚类中获得的质心来替代原有的数据,可以把数据上的信息量压缩到非常小,但又不损失太多信息。
1、导入需要的库
import numpy as np
import matplotlib.pyplot as plt
from sklearn.cluster import KMeans

#对两个序列中的点进行距离匹配的函数
from sklearn.metrics import pairwise_distances_argmin
#导入图片数据所用的库
from sklearn.datasets import load_sample_image

#打乱顺序,洗牌的一个函数
from sklearn.utils import shuffle
2、导入数据,探索数据
#导入颐和园的照片
china = load_sample_image("china.jpg")

# 长度为427,宽度为640,3个像素  组成来表示颜色
china.shape
(427, 640, 3)
#查看包含有多少种颜色
new_image = china.reshape((-1,3))
new_image.shape  # (273280, 3)发现颜色数量有27W+
(273280, 3)
import pandas as pd

#(96615, 3),去除重复后也即只有9W多种颜色
pd.DataFrame(new_image).drop_duplicates().shape
(96615, 3)
#查看图片
plt.figure(figsize=(10,10))
plt.imshow(china)
图像探索完毕,我们了解了,图像现在有9W多种颜色。我们希望来试试看,能否使用K-Means将颜色压缩到64种,还不严重损耗图像的质量。为此,我们要使用K-Means来将9W种颜色聚类成64类,然后使用64个簇的质心来替代全部的9W种颜色,记得质心有着这样的性质:簇中的点都是离质心最近的样本点。
为了比较,我们还要画出随机压缩到64种颜色的矢量量化图像。我们需要随机选取64个样本点作为随机质心,计算原数据中每个样本到它们的距离来找出离每个样本最近的随机质心,然后用每个样本所对应的随机质心来替换原本的样本。两种状况下,我们观察图像可视化之后的状况,以查看图片信息的损失。
在这之前,我们需要把数据处理成sklearn中的K-Means类能够接受的数据。
3、决定超参数,数据预处理
#压缩成64种颜色
n_clusters = 64

#plt.imshow在浮点数上表现非常优异。在这里我们把china中的数据。转换为浮点数,压缩到[0,1]之间
china = np.array(china, dtype=np.float64) / china.max()
china[:1]
array([[[0.68235294, 0.78823529, 0.90588235],
        [0.68235294, 0.78823529, 0.90588235],
        [0.68235294, 0.78823529, 0.90588235],
        ...,
        [0.98039216, 0.98431373, 1.        ],
        [0.98039216, 0.98431373, 1.        ],
        [0.98039216, 0.98431373, 1.        ]]])
image_array = np.reshape(china, (-1, 3))

image_array.shape
(273280, 3)
4、对数据进行K-Means的矢量量化
# 首先,先使用1800个数据来找出质心
image_array_sample = shuffle(image_array, random_state=0)[:1000]
kmeans = KMeans(n_clusters=n_clusters, random_state=0).fit(image_array_sample)

kmeans.cluster_centers_
array([[0.62570806, 0.60261438, 0.53028322],
       [0.15546218, 0.1557423 , 0.12829132],
       [0.82063983, 0.89896801, 0.98462332],
       ......
       [0.39843137, 0.44980392, 0.42      ],
       [0.73524384, 0.82021116, 0.91925591],
       [0.20627451, 0.07816993, 0.07660131]])
#找出质心之后,按照已存在的质心对所有数据进行聚类
labels = kmeans.predict(image_array)
labels
array([62, 62, 62, ..., 1, 6, 6])
image_kmeans = kmeans.cluster_centers_[labels]
pd.DataFrame(image_kmeans).drop_duplicates().shape
(64, 3)
image_kmeans = image_kmeans.reshape(china.shape)
image_kmeans.shape
(427, 640, 3)
5、对数据进行随机矢量化
centroid_random = shuffle(image_array, random_state=0)[:n_clusters]

#函数pairwise_distances_argmin(x1,x2,axis)#x1利lx2分别是序列
#用来计算x2中的每个样本到x1中的每个样本点的距离,并返回和x2相同形状的,x1中对应的最近的样本点的索引
labels_random = pairwise_distances_argmin(centroid_random,image_array,axis=0)
labels_random
array([55, 55, 55, ..., 52, 60, 60], dtype=int64)
#随机质心来替换所有样本
image_random = centroid_random[labels_random]
pd.DataFrame(image_random).drop_duplicates().shape
(64, 3)
image_random = image_random.reshape(china.shape)
image_random.shape
(427, 640, 3)
6、将原图,按KMeans矢量量化和随机矢量量化的图像绘制出来
plt.figure(figsize=(10,10))
plt.axis('off')
plt.title('Original image (96,615 colors)')
plt.imshow(china)

plt.figure(figsize=(10,10))
plt.axis('off')
plt.title('Quantized image (64 colors, K-Means)')
plt.imshow(image_kmeans)

plt.figure(figsize=(10,10))
plt.axis('off')
plt.title('Quantized image (64 colors, Random)')
plt.imshow(image_random)

plt.show()


