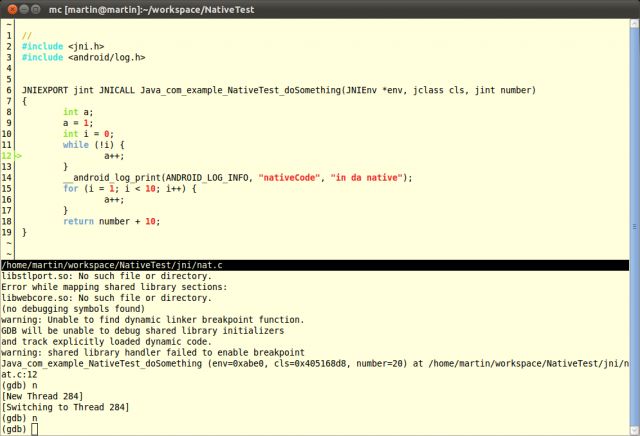
Using cgdb with ndk-debug (and cgdb tutorial)
http://mhandroid.wordpress.com/2011/01/23/using-cgdb-with-ndk-debug-and-cgdb-tutorial/
Android ndk (http://developer.android.com/sdk/ndk/index.html) comes with ndk-gdbcommand that starts gdb debugger and connects it to Android application.
cgdb (http://cgdb.sourceforge.net/) is superior console front-end to gdb so it seems logical to use it for debugging of Android applications. Following modification of ndk-gdbscript will cause that cgdb will be invoked instead of gdb.
Original ndk-gdb (Android NDK, r5):
# Now launch the appropriate gdb client with the right init commands
#
GDBCLIENT=${TOOLCHAIN_PREFIX}gdb
GDBSETUP=$APP_OUT/gdb.setup
Modified ndk-gdb (originally from Android NDK, r5) which uses cgdb instead of gdb:
# Now launch the appropriate gdb client with the right init commands
#
GDBCLIENT="cgdb -d ${TOOLCHAIN_PREFIX}gdb --"
GDBSETUP=$APP_OUT/gdb.setup
Now if you run ndk-gdb you will get cgdb front-end.

Small cgdb tutorial
In cgdb you can have focus either on source window (part with the source text) or gdbwindow.
To switch from source window to gdb press i.
To switch from gdb window to source press esc.
Commands you can use in source window:
arrows — scroll the text
space — set or delete breakpoint
o — open source file
i — switch focus to gdb window
- — make source window 1 line smaller
= — make source window 1 line bigger
Commands you can use in gdb window:
n — next instruction. Will not dive into subfunctions
s — step. Will dive into subfunctions
c — continue
b — set breakpoint
bt — show call stack (backtrace)
info threads — show information about running threads
info breakpoints — show information about breakpoints
pgup, pgdown — scroll the content of gdb window
esc — switch focus to source windows
Full cgdb documentation is at http://cgdb.sourceforge.net/docs/cgdb-no-split.html
Full gdb documentation is at http://www.gnu.org/software/gdb/documentation/
Have fun!