Linux部署Prometheus_VictoriaMetrics监控环境
Linux部署P8s/VM+exporter+grafana+alertmanager监控环境
一、基础软件安装【二进制安装】【docker安装】
- victoria-metrics安装
mkdir -p /data/victoria-metrics

wget https://github.com/VictoriaMetrics/VictoriaMetrics/releases/download/v1.65.0/victoria-metrics-amd64-v1.65.0.tar.gz
mkdir victoria-metrics && tar -xvzf victoria-metrics-amd64-v1.65.0.tar.gz
mv victoria-metrics-prod victoria-metrics/victoria-metrics
- P r o m e t h e u s \textcolor{blue}{Prometheus} Prometheus安装
mkdir -p /data/prometheus
cd /data/prometheus
wget https://github.com/prometheus/prometheus/releases/download/v2.34.0/prometheus-2.34.0.linux-386.tar.gz
tar xf prometheus-2.34.0.linux-386.tar.gz
mv prometheus-2.34.0.linux-386 prometheus
-
Blackbox_exporter、node_exporter、snmp_exporter、ping_exporter安装
cd /data/prometheus/ wget https://github.com/prometheus/blackbox_exporter/releases/download/v0.15.1/blackbox_exporter-0.20.0.linux-amd64.tar.gz tar xf blackbox_exporter-0.20.0.linux-amd64.tar.gz mv blackbox_exporter-0.20.0.linux-amd64 blackbox_exporter wget https://github.com/prometheus/node_exporter/releases/download/v1.3.1/node_exporter-1.3.1.linux-amd64.tar.gz tar xf node_exporter-1.3.1.linux-amd64.tar.gz mv node_exporter-1.3.1.linux-amd64 node_exporter wget https://github.com/prometheus/snmp_exporter/releases/download/v0.20.0/snmp_exporter-0.20.0.linux-amd64.tar.gz tar xf snmp_exporter-0.20.0.linux-amd64.tar.gz mv snmp_exporter-0.20.0.linux-amd64 snmp_exporter #已经是二进制文件 wget https://github.com/czerwonk/ping_exporter/releases/download/1.0.0/ping_exporter_1.0.0_linux_amd64.tar.gz tar xf ping_exporter_1.0.0_linux_amd64.tar.gz -
grafana安装
wget https://dl.grafana.com/oss/release/grafana-8.4.4-1.x86_64.rpm sudo yum localinstall grafana-8.4.4-1.x86_64.rpm -
alertmanager安装
wget https://github.com/prometheus/alertmanager/releases/download/v0.24.0/alertmanager-0.24.0.linux-amd64.tar.gz tar xf alertmanager-0.24.0.linux-amd64.tar.gz mv alertmanager-0.24.0.linux-amd64 alertmanager -
docker安装【由于已经使用虚拟机,避免多层网络,因此本文未使用】
docker search prom/prometheus
docker pull prom/prometheus

docker run -itd --name prometheus -p 9090:9090 \
-v /usr/local/promethues/server/prometheus.yml:/etc/prometheus/prometheus.yml \
-v /etc/localtime:/etc/localtime:ro \
prom/prometheus

宿主机位置  /usr/local/promethues/server/prometheus.yml
容器位置   /etc/prometheus/prometheus.yml
docker search grafana/grafana docker pull grafana/grafana # -d:后台运行 # -p:将容器内部端口向外映射 # --name:命名容器名称 # -v:将容器内数据文件夹或者日志、配置等文件夹挂载到宿主机指定目录 docker run -d -p 3000:3000 --restart=always --name grafana grafana/grafanadocker pull prom/blackbox-exporter docker run -d -p 9115:9115 --name blackbox-exporter prom/blackbox-exporter
二、设置supervisor管理,并开机自启 – 需要将步骤一的成品文件/文件夹移动到/usr/local/server-path/
cd /etc/supervisord.d/
-
prometheus.conf
[program:prometheus-server] directory = /usr/local/server-path/prometheus command= /usr/local/server-path/prometheus/prometheus autostart=true autorestart=true startsecs=10 stdout_logfile_maxbytes=1MB stdout_logfile_backuos=10 stderr_logfile_maxbytes=1MB stderr_logfile_backuos=10 stderr_capture_maxbytes=1MB -
blackbox_exporter.conf
[program:blackbox_exporter-server] directory = /usr/local/server-path/blackbox_exporter command= /usr/local/server-path/blackbox_exporter/blackbox_exporter autostart=true autorestart=true startsecs=10 stdout_logfile_maxbytes=1MB stdout_logfile_backuos=10 stderr_logfile_maxbytes=1MB stderr_logfile_backuos=10 stderr_capture_maxbytes=1MB -
ping_exporter.conf
[program:ping-exporter-server] directory = /usr/local/server-path/ping_exporter command= /usr/local/server-path/ping_exporter/ping_exporter --config.path /usr/local/server-path/ping_exporter/config.yml autostart=true autorestart=true startsecs=10 stdout_logfile_maxbytes=1MB stdout_logfile_backuos=10 stderr_logfile_maxbytes=1MB stderr_logfile_backuos=10 stderr_capture_maxbytes=1MB -
grafana.conf
[program:grafana-server] directory = /usr/sbin/ command= /usr/sbin/grafana-server web --homepath "/usr/share/grafana" autostart=true autorestart=true startsecs=10 stdout_logfile_maxbytes=1MB stdout_logfile_backuos=10 stderr_logfile_maxbytes=1MB stderr_logfile_backuos=10 stderr_capture_maxbytes=1MB -
alertmanager.conf
[program:alertmanager-server] directory = /usr/local/server-path/alertmanager command= /usr/local/server-path/alertmanager/alertmanager --config.file=/usr/local/server-path/alertmanager/alertmanager.yml autostart=true autorestart=true startsecs=10 stdout_logfile_maxbytes=1MB stdout_logfile_backuos=10 stderr_logfile_maxbytes=1MB stderr_logfile_backuos=10 stderr_capture_maxbytes=1MB -
victoria-metrics.conf
[program:victoria_metrics-server] directory = /usr/local/server-path/victoria-metrics command= /usr/local/server-path/victoria-metrics/victoria-metrics -retentionPeriod=30d -storageDataPath=data # 如果采用VM完全代替Prometheus,则为:/usr/local/server-path/victoria-metrics/victoria-metrics -retentionPeriod=30d -storageDataPath=data -promscrape.config=prometheus.yml autostart=true autorestart=true startsecs=10 stdout_logfile_maxbytes=1MB stdout_logfile_backuos=10 stderr_logfile_maxbytes=1MB stderr_logfile_backuos=10 stderr_capture_maxbytes=1MB -
other
三、设置systemctl管理,并开机自启
-
prometheus.service
vim /usr/lib/systemd/system/prometheus.service 并写入以下内容 [Unit] Description=prometheus server daemon [Service] Restart=on-failure ExecStart=/usr/local/server-path/prometheus/prometheus --config.file=/usr/local/server-path/prometheus/prometheus.yml [Install] WantedBy=multi-user.target -
blackbox_exporter.service
vim /usr/lib/systemd/system/blackbox_exporter.service


[Unit]
Description=blackbox_exporter
After=network.target

[Service]
ExecStart=/usr/local/server-path/prometheus/blackbox_exporter/blackbox_exporter --config.file=/usr/local/server-path/prometheus/blackbox_exporter/blackbox.yml
Restart=on-failure

[Install]
WantedBy=multi-user.target
四、icmp连通性探测测试
-
prometheus配置文件
./promtool check config prometheus.yml # 用于检查配置
./amtool check-config alertmanager.yml
# my global config global: scrape_interval: 15s # Set the scrape interval to every 15 seconds. Default is every 1 minute. evaluation_interval: 15s # Evaluate rules every 15 seconds. The default is every 1 minute. # scrape_timeout is set to the global default (10s). # Alertmanager configuration alerting: alertmanagers: - static_configs: - targets: # - alertmanager:9093 # Load rules once and periodically evaluate them according to the global 'evaluation_interval'. rule_files: # - "first_rules.yml" # - "second_rules.yml" # A scrape configuration containing exactly one endpoint to scrape: # Here it's Prometheus itself. scrape_configs: # The job name is added as a label `job=` to any timeseries scraped from this config. - job_name: 'ICMP-Demo' # metrics_path defaults to '/metrics' # scheme defaults to 'http'. # static_configs: # - targets: ['localhost:9090'] scrape_interval: 5s metrics_path: /probe params: module: [icmp] #ping file_sd_configs: - files: ['/usr/local/prometheus/ping_config/hk.yml'] relabel_configs: - source_labels: [__address__] target_label: __param_target - source_labels: [__param_target] target_label: instance - target_label: __address__ replacement: 114.112.34.221:9115 -
hk.yml的配置
- targets: ['128.14.237.64'] labels: HK: '台湾台北' - targets: ['159.138.50.183'] labels: HK: '香港' - targets: ['128.1.37.65'] labels: HK: '台湾高雄' - targets: ['163.53.244.90'] labels: HK: '澳门' -
启动各个服务、登录prometheus-web界面:http://ip:9090/targets
记得关闭防火墙
systemctl stop firewalld.service
systemctl disable firewalld.service

systemctl restart prometheus.service
systemctl restart blackbox_exporter.service
systemctl start grafana-server
五、使用victoria-metrics【VM】替代Prometheus存储数据(p8s+vm+exporter+grafana)–单机版
-
部署victoria-metrics服务–详见步骤一、二执行类似操作
-
更新Prometheus配置文件
新增配置如下:
remote_write: # 存储到远程VM存储(这里只是示例,所以Prometheus和VM在一台机子上) - url: http://127.0.0.1:8428/api/v1/write queue_config: # 如果Prometheus抓取指标很大,可以加调整queue,但是会提高内存占用 max_samples_per_send: 10000 capacity: 20000 max_shards: 30 -
更新grafana数据源配置,新增victoria-metrics数据源
登录grafana页面 找到设置 --> 数据源【data sources】--> add data resource name: VM URL: http://localhost[宿主机ip]:8428 点击save & test -
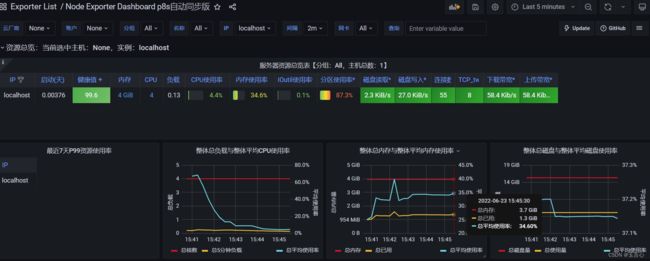
展示
将之前Prometheus的图表的数据源换成VM即可【也可以cp一份测试】
六、使用victoria-metrics【VM】替代Prometheus(vm+exporter+grafana) --单机版
-
复制Prometheus配置
cp /usr/local/server-path/prometheus/prometheus.yml /usr/local/server-path/victoria-metrics/ -
停止Prometheus、增加启动项、直接使用VM加载Prometheus配置文件、grafana保持不变
具体执行指令:
supervisorctl stop prometheus-server
./victoria-metrics -retentionPeriod=30d -storageDataPath=data -promscrape.config=prometheus.yml
七、对接alertmanager报警
-
部署alertmanager服务–详见步骤一、二操作
-
更新alertmanager配置、配置报警邮箱
cd /usr/local/server-path/alertmanager/
vim alertmanager.yml
global: resolve_timeout: 5m smtp_smarthost: 'smtp.qq.com:465' smtp_from: 'qq@qq.com'#换成自己qq smtp_auth_username: 'qq@qq.com' smtp_auth_password: 'xxxx' #qq邮箱授权码 smtp_require_tls: false templates: #报警文案自定义路径 - '/usr/local/server-path/alertmanager/message-tmpl/*.tmpl' #与报警及其周期有关,自行百度,配置参数 route: group_by: ['severity'] group_wait: 10s group_interval: 3m repeat_interval: 3m receiver: 'email' routes: - match: severity: critical receiver: 'leader' continue: true receivers: - name: 'email' email_configs: - to: 'qq@qq.com' html: '{{ template "email.to.html" . }}' send_resolved: true - name: 'leader' email_configs: - to: 'qq@qq.com' html: '{{ template "email.to.html" . }}' send_resolved: true inhibit_rules: - source_match: severity: 'critical' target_match: severity: 'warning' equal: ['alertname', 'instance']mkdir message-tmpl #为后文报警文案做准备 -
更新Prometheus配置
# my global config
global:
  scrape_interval: 15s # Set the scrape interval to every 15 seconds. Default is every 1 minute.
  evaluation_interval: 15s # Evaluate rules every 15 seconds. The default is every 1 minute.
  # scrape_timeout is set to the global default (10s).

# Alertmanager configuration 此处更新Alertmanager服务地址
alerting:
  alertmanagers:
    - static_configs:
        - targets:
           - localhost:9093

# Load rules once and periodically evaluate them according to the global 'evaluation_interval'.
# 报警规则配置路径,可以自定义
rule_files:
    - "rules/*.yml"
  # - "first_rules.yml"
  # - "second_rules.yml"

# A scrape configuration containing exactly one endpoint to scrape:
# Here it's Prometheus itself.
scrape_configs:

....后面略
mkdir rules/ -
自定义报警文案
cd message-tmpl
vim email.tmpl
{{ define "email.to.html" }} {{ range .Alerts }}
告警程序: prometheus_alert
告警级别: {{ .Labels.severity }} 级
告警类型: {{ .Labels.alertname }}
故障主机: {{ .Labels.instance }}
告警主题: {{ .Annotations.summary }}
告警详情: {{ .Annotations.description }}
触发时间: {{ .StartsAt }}
{{ end }} {{ end }} -
配置exporter服务死活报警
cd rules/
vim exporter_monitor.yml
groups: - name: node-up rules: - alert: node-up expr: up == 0 for: 180s labels: severity: 1 team: node annotations: summary: "【服务异常告警】" description: "---{{$labels.instance}}--- 相关服务可能不可用,服务停止已超过3min,请检查." value: "{{ $value }}" -
检查格式、重启Prometheus、Alertmanager,手动停止一个exporter验证
【本文中涉及配置是挂起3min,三分钟报警没有恢复则发送邮箱】
效果示例:
-
总结
本文涉及服务:【使用supervisor管理】
alertmanager-server              RUNNING   pid 16163, uptime 0:57:04
blackbox_exporter-server         RUNNING   pid 16155, uptime 0:57:04
go-http-server                   RUNNING   pid 16162, uptime 0:57:04
grafana-server                   RUNNING   pid 16154, uptime 0:57:04
node-exporter-server             RUNNING   pid 16158, uptime 0:57:04
ping-exporter-server             RUNNING   pid 16170, uptime 0:57:04
prometheus-server                RUNNING   pid 28301, uptime 0:52:18
snmp-exporter-server             RUNNING   pid 16157, uptime 0:57:04
victoria_metrics-server          RUNNING   pid 16153, uptime 0:57:04

功能:实现Prometheus生态的单机版云监控,集群版请自行百度部署,原理类似
应用:监控小量级的业务数据,个人项目数据【exporter/metres暴露接口自己开发,不难】等
注意:本文由于是工作中记录的,或有整合网上多个方案,如有问题,请私聊