Linear Regression -- 线性回归
机器学习
"Fiele of study that gives computers the ability to learn withouut being explicity programmed." -- Arthur Samuel (1959)
机器学习分为两大类,一类是监督学习(supervised learning),一类是非监督学习(unsurpervised learning)。监督学习中又有常见的两大类,一类是回归(regression),一类是分类(classification)。
简单来说,监督学习就是给机器学习的训练集有标注(label),告诉机器什么是“正确的”;而非监督学习就是只提供数据集,让机器自己试图找出数据集的某些“结构”。
举个例子,假如你要对某地的房价进行预测,首先你告诉机器之前的房子信息(大小,房间数,年龄...)和相应的房价,然后让机器学习房价和房子信息之间的相关参数,再用这些参数(模型)去对新的房价进行预测。在这个过程中,你提供给机器的数据称为训练集(training set),机器学习到的参数集合称为模型(model),最终预测的房价称为测试集(test set),预测的准确与否可以作为性能度量(performance)。此外,由于该例子中,我们在训练集给出了相对于的房价(“right answer" or "label"),所以这种机器学习被称为监督学习。
还有一个监督学习的例子,假如你要根据肿瘤的大小预测肿瘤的良性还是恶性(benign or malignant),在训练集中,你对不同大小的肿瘤进行标记,通过模型训练后,拿来预测新的肿瘤是否为恶性肿瘤。这也是监督学习的例子,不同于上一个例子用来预测数据(regression),这个例子是用来分类(classification)。到这,我们可以总结,监督学习的关键在于标记(label),就好像我们人为给机器加了一些限定和法则,告诉机器具体的数据大小和种类有那些(理解监督学习的含义)。
非监督学习举例,延续上个例子,假如我们没有给训练集进行标记,而是告诉机器,我有这些数据(不同肿瘤的大小,生长年龄),然后让机器试图对这些数据进行分类,如果数据结构比较明显,机器也许能分出两大类,告诉我们,这些数据可能代表着两种不同的东西。
日常生活中,非监督学习的应用有很多,例如:Google news,DNA microarray,Grouping customes... 这些都属于非监督学习的聚类(Clustering)。还有其他类型,如:异常检测(Anomaly detection),数据降维(Dimensionality reduction)...
线性回归 (Linear regression)
在上面我们举了房价预测的例子,这就是一种线性回归的例子。我们想通过寻找其他房子的房子信息与房价之间的关系,来对新的房价进行预测。
首先,我们要对问题抽象出相应的符合表示(Notation)。
xj: 代表第j个特征 x(i):代表第i个样本
x(i) j:代表第i个样本的第j个特征 y(i):代表第i个样本的标记(房价)
wj:第j个特征的系数 b:系数常量
线性模型:f(x) = w1 * x1 + w2 * x2 + ... + wn * xn + b
向量化(vectorization):![]()
(向量化能简化公式表示,更重要的是,有numpy库的支持,向量化表示能大大减少代码量和计算时间)代码如下:
import numpy as np
w = np.array([w1, w2, w3])
b = 4
x = np.array([x1, x2, x3])
f = np.dot(w, x) + b
代价函数(Cost Function)
接着,我们要定义代价函数(cost function) 也叫损失函数(loss function)
什么是代价函数?
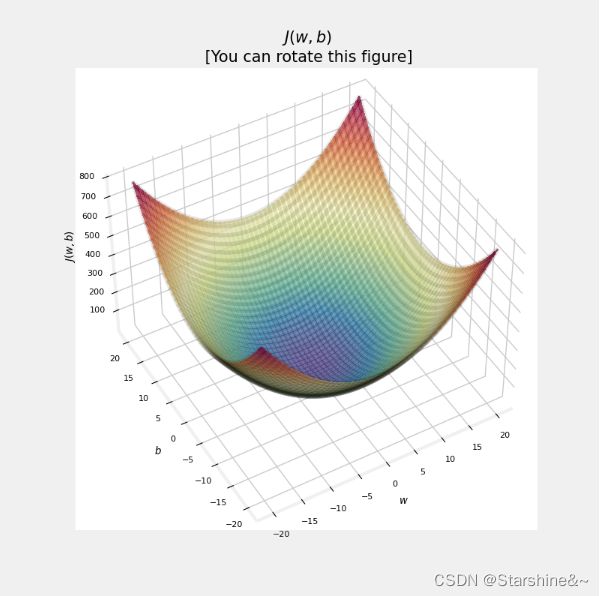
代价函数是用来衡量模型预测与真实值之间的差距,对于多个样本而言,我们可以通过求平均值来衡量模型预测与真实值之间的平均差距J(θ),进而评价模型的好坏。在训练模型的过程中,我们就是想让机器通过不断的调整参数,来使用定义好的代价函数不断下降,当我们取到minJ(θ)最小值的时候,我们就得到了最完美的参数。
代价函数定义:
![]()
这里,我们用了均方误差(Mean squared error)函数来定义代价函数。系数2m是为了方便后面求导时多出来的2进行约分。均分误差有个很好的特点,那就是几何上函数都是碗状形(bow-shape),这种良好的形状保证我们只有一个最优解。事实上,函数可能有很多的局部最小值(local mininum),这种情况可能让我们通过梯度下降(gradient descent)训练出来的模型并不是最优解。而在本例中,我们将不用考虑这种情况!
def compute_cost(x, y, w, b):
    """
    Computes the cost function for linear regression.

    Args:
      x (ndarray (m,)): Data, m examples
      y (ndarray (m,)): target values
      w,b (scalar)    : model parameters

    Returns
        total_cost (float): The cost of using w,b as the parameters for linear regression
               to fit the data points in x and y
    """
    # number of training examples
    m = x.shape[0]

    cost_sum = 0
    for i in range(m):
        f_wb = w * x[i] + b
        cost = (f_wb - y[i]) ** 2
        cost_sum = cost_sum + cost
    total_cost = (1 / (2 * m)) * cost_sum

    return total_cost
(注:x.shape[0] 得到 x 矩阵的行数,关于numpy的用法可以参考What is NumPy? — NumPy v1.24 Manual)
梯度下降 (Gradient descent)
寻找最优解 —— 梯度下降(gradient descent)
方法概述:
1. 从最开始定义的参数 w,b 开始
2. 通过梯度下降不断改变参数来减少代价函数
3. 直到我们到达最小值或接近最小值时停止
Gradient descent:
repeat {
![]()
![]()
(simultaneously update w and b)
} until convergence
注意在调整参数时,w和b要同时调整,也就是说不能用调整好w的函数代入b的更新数中,两者应该使用同样的f(x)
def compute_gradient(x, y, w, b):
    """
    Computes the gradient for linear regression
    Args:
      x (ndarray (m,)): Data, m examples
      y (ndarray (m,)): target values
      w,b (scalar)    : model parameters
    Returns
      dj_dw (scalar): The gradient of the cost w.r.t. the parameters w
      dj_db (scalar): The gradient of the cost w.r.t. the parameter b
     """

    # Number of training examples
    m = x.shape[0]
    dj_dw = 0
    dj_db = 0

    for i in range(m):
        f_wb = w * x[i] + b
        dj_dw_i = (f_wb - y[i]) * x[i]
        dj_db_i = f_wb - y[i]
        dj_db += dj_db_i
        dj_dw += dj_dw_i
    dj_dw = dj_dw / m
    dj_db = dj_db / m

    return dj_dw, dj_db

def gradient_descent(x, y, w_in, b_in, alpha, num_iters, cost_function, gradient_function):
    """
    Performs gradient descent to fit w,b. Updates w,b by taking
    num_iters gradient steps with learning rate alpha

    Args:
      x (ndarray (m,))  : Data, m examples
      y (ndarray (m,))  : target values
      w_in,b_in (scalar): initial values of model parameters
      alpha (float):     Learning rate
      num_iters (int):   number of iterations to run gradient descent
      cost_function:     function to call to produce cost
      gradient_function: function to call to produce gradient

    Returns:
      w (scalar): Updated value of parameter after running gradient descent
      b (scalar): Updated value of parameter after running gradient descent
      J_history (List): History of cost values
      p_history (list): History of parameters [w,b]
      """

    w = copy.deepcopy(w_in) # avoid modifying global w_in
    # An array to store cost J and w's at each iteration primarily for graphing later
    J_history = []
    p_history = []
    b = b_in
    w = w_in

    for i in range(num_iters):
        # Calculate the gradient and update the parameters using gradient_function
        dj_dw, dj_db = gradient_function(x, y, w , b)

        # Update Parameters using equation (3) above
        b = b - alpha * dj_db
        w = w - alpha * dj_dw

        # Save cost J at each iteration
        if i<100000:      # prevent resource exhaustion
            J_history.append( cost_function(x, y, w , b))
            p_history.append([w,b])
        # Print cost every at intervals 10 times or as many iterations if < 10
        if i% math.ceil(num_iters/10) == 0:
            print(f"Iteration {i:4}: Cost {J_history[-1]:0.2e} ",
                  f"dj_dw: {dj_dw: 0.3e}, dj_db: {dj_db: 0.3e}  ",
                  f"w: {w: 0.3e}, b:{b: 0.5e}")

    return w, b, J_history, p_history #return w and J,w history for graphing
学习率α (learning rate)
在梯度下降算法中,有一个参数α,我们称为学习率。学习率,顾名思义,就是学习的效率。那么,学习率是否越大越好呢?
通过将梯度下降过程图像化,我们可以发现,如果学习率过大,代价函数反而不降反升!So bad!
什么原因导致这种情况的发生呢?观察代价函数图像,我们可以看出,如果参数w从右侧出发,导数小于0,代入梯度下降公式会使w增加,向右前进(图三);反之亦然(vice versa)。但如果学习率过大,每次跨的距离过大(big step),就会错过最小值的点,甚至导致函数不收敛(如图一)。如果学习率过小(baby step),则每次跨的距离太小,导致算法速度过慢,迭代次数过多。
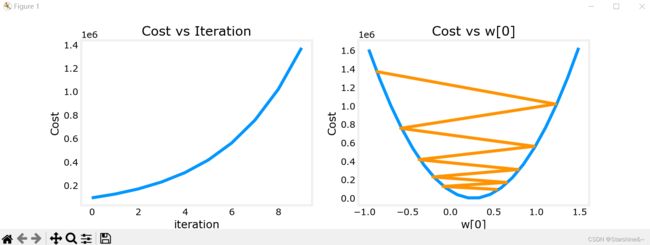 图一
图一
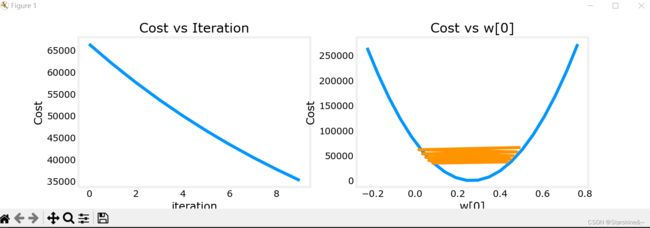 图二
图二 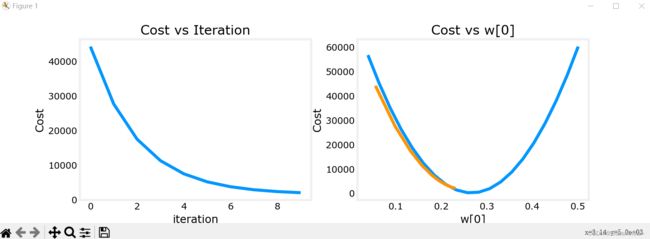
图三
代码如下:
import numpy as np
import matplotlib.pyplot as plt
from lab_utils_multi import  load_house_data, run_gradient_descent
from lab_utils_multi import  norm_plot, plt_equal_scale, plot_cost_i_w
from lab_utils_common import dlc
np.set_printoptions(precision=2)
plt.style.use('deeplearning.mplstyle')

# load the dataset
X_train, y_train = load_house_data()
X_features = ['size(sqft)','bedrooms','floors','age']

fig,ax=plt.subplots(1, 4, figsize=(12, 3), sharey=True)
for i in range(len(ax)):
    ax[i].scatter(X_train[:,i],y_train)
    ax[i].set_xlabel(X_features[i])
ax[0].set_ylabel("Price (1000's)")
plt.show()

#set alpha to 9.9e-7
_, _, hist = run_gradient_descent(X_train, y_train, 10, alpha = 9.9e-7)
plot_cost_i_w(X_train, y_train, hist)

#set alpha to 9e-7
_, _, hist = run_gradient_descent(X_train, y_train, 10, alpha = 9e-7)
plot_cost_i_w(X_train, y_train, hist)

#set alpha to 1e-7
_, _, hist = run_gradient_descent(X_train, y_train, 10, alpha = 1e-7)
plot_cost_i_w(X_train, y_train, hist)
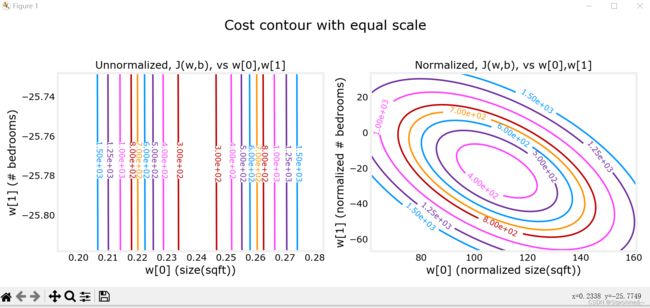
特征缩放(feature scaling)
回到主题 —— 房价预测,我们提供房子的信息包括房子大小(size),使用年龄(age)等等,这些特征的取值范围不同,数量级也不同。数据本身带有量纲,范围变化也大小不一,可能导致图像化时表现为拥挤,系数数量级差过大等等。总之,使用原始数据会导致种种的不变,因此,我们要对其进行特征缩放,让不同特征数量级相对接近。
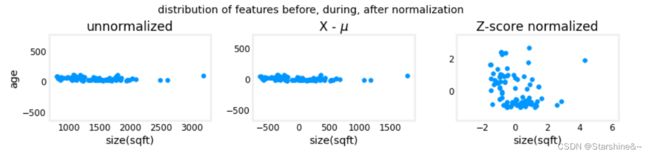
特征放缩有几种常见的方法:
1. Mean normalization(均值归一法)
![]()
max, min: x 取值的最大值和最小值
2. Z-score normalization
![]()
这些方法都试图将数据集中(close -1 - 1),将平均值取为0,缩小数据范围。
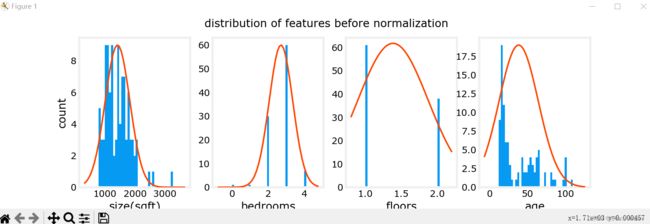
before feature scaling
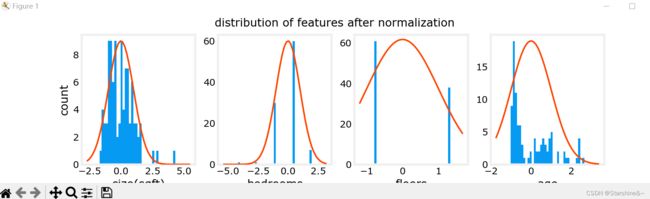
after feature scaling
def zscore_normalize_features(X):
    """
    computes  X, zcore normalized by column

    Args:
      X (ndarray (m,n))     : input data, m examples, n features

    Returns:
      X_norm (ndarray (m,n)): input normalized by column
      mu (ndarray (n,))     : mean of each feature
      sigma (ndarray (n,))  : standard deviation of each feature
    """
    # find the mean of each column/feature
    mu = np.mean(X, axis=0)  # mu will have shape (n,)
    # find the standard deviation of each column/feature
    sigma = np.std(X, axis=0)  # sigma will have shape (n,)
    # element-wise, subtract mu for that column from each example, divide by std for that column
    X_norm = (X - mu) / sigma

    return (X_norm, mu, sigma)
特征工程(feature engineer)
上面我们提到的都是线性回归(linear regression),然而,在现实生活中,模型不都是线性关系的。就如房价和年龄不一定符合线性关系,有可能是平方关系。此外,不同特征之间的关系可能对结果造成影响。
举个例子,假如我们现在预测一块地皮的价格,价格可能和长度(x1)有关,可能和宽度(x2)有关,你可能会对这两个特征进行提取预测。然而,事实上,地皮的价格还跟面积有关(x1*x2),并且通常情况下,我们就是根据面积在计算地皮价格。x1 * x2 就是我们根据 x1 和 x2 两个特征新创造出来的特征,注意,这将导致我们的模型不在是线性的。
特征选择
对于原有的特征x1,x2,我们能创造出很多新的特征:x1**2,x2**2,x1**3,x1*x2 ...
如何选择呢?我们从一个简单例子讲起:=1+2
假如真实模型是二次关系,而我们依旧选择线性关系模型来预测(f(x) = wx + b):
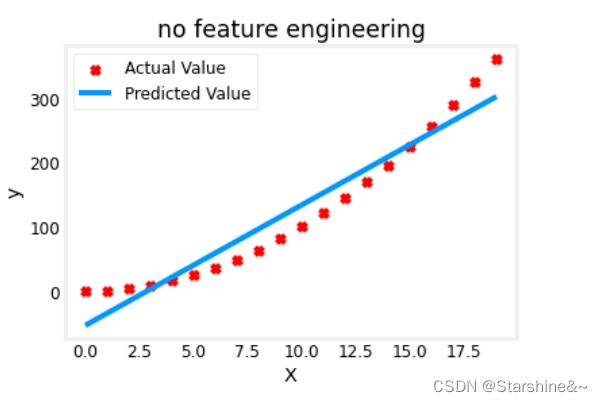
可以看到,线性模型来预测二次关系并不是很理想。
# create target data
x = np.arange(0, 20, 1)
y = 1 + x**2
X = x.reshape(-1, 1)

model_w,model_b = run_gradient_descent_feng(X,y,iterations=1000, alpha = 1e-2)

plt.scatter(x, y, marker='x', c='r', label="Actual Value"); plt.title("no feature engineering")
plt.plot(x,X@model_w + model_b, label="Predicted Value");  plt.xlabel("X"); plt.ylabel("y"); plt.legend(); plt.show()
如果我们使用二次模型,将会很好地符合数据(f(x) = w * x**2 + b):
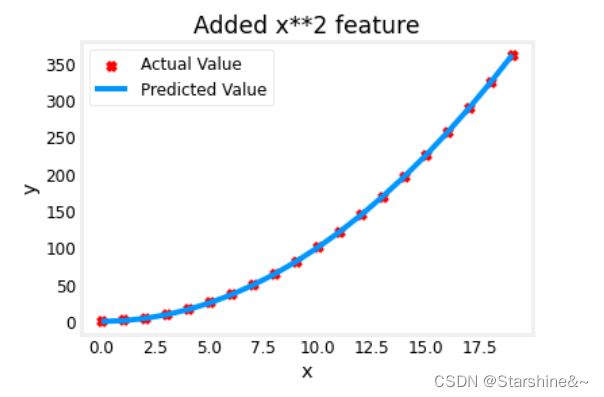
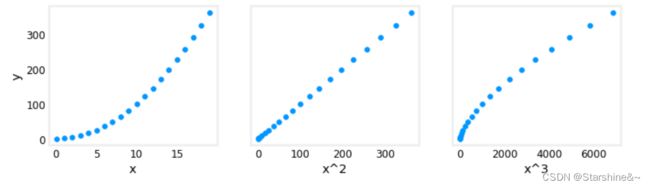
如果我们选择三次模型呢(f(x) = w1 * x + w2 * x**2 + w3 * x**3 + b):
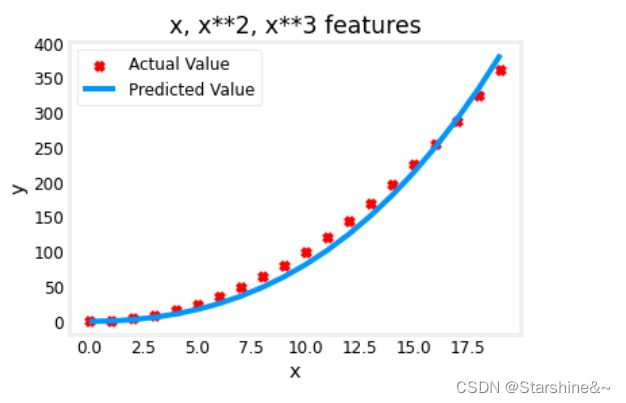
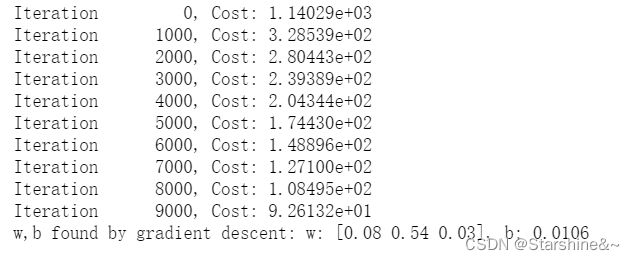
# create target data
x = np.arange(0, 20, 1)
y = x**2

# engineer features .
X = np.c_[x, x**2, x**3]   #<-- added engineered feature

model_w,model_b = run_gradient_descent_feng(X, y, iterations=10000, alpha=1e-7)

plt.scatter(x, y, marker='x', c='r', label="Actual Value"); plt.title("x, x**2, x**3 features")
plt.plot(x, X@model_w + model_b, label="Predicted Value"); plt.xlabel("x"); plt.ylabel("y"); plt.legend(); plt.show()
观察数据,我们可以看到,w1,w3都比较小,接近0;也就是说,在梯度下降的过程中,我们找到了数据的某些特征,它和二次型比较接近,而与线性和三次型相关性比较低。也就是说,这个数据很可能是平方相关的。
Gradient descent is picking the 'correct' features for us by emphasizing its associated parameter
从另一个角度看,只有x**2这个特征和y是线性相关的,也就是说,我们用x**2作为特征,依然可以运用线性回归进行预测。
# create target data
x = np.arange(0, 20, 1)
y = x**2

# engineer features .
X = np.c_[x, x**2, x**3]   #<-- added engineered feature
X_features = ['x','x^2','x^3']

fig,ax=plt.subplots(1, 3, figsize=(12, 3), sharey=True)
for i in range(len(ax)):
    ax[i].scatter(X[:,i],y)
    ax[i].set_xlabel(X_features[i])
ax[0].set_ylabel("y")
plt.show()
对于一些复杂的函数,如:y = cos(x/2),我们依旧可以用特征工程来模拟,使用梯度下降会为我们自动选择合适的特征工程,增大它的相关系数,减小相关性较小的特征系数。观察结果系数值,我们也可以人为为模型选择合适的特征再进行模拟。
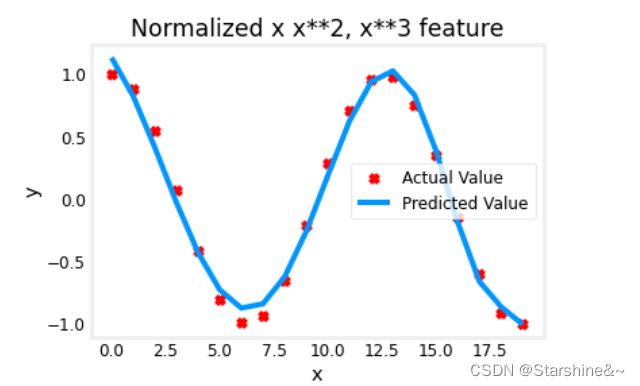
x = np.arange(0,20,1)
y = np.cos(x/2)

X = np.c_[x, x**2, x**3,x**4, x**5, x**6, x**7, x**8, x**9, x**10, x**11, x**12, x**13]
X = zscore_normalize_features(X)

model_w,model_b = run_gradient_descent_feng(X, y, iterations=1000000, alpha = 1e-1)

plt.scatter(x, y, marker='x', c='r', label="Actual Value"); plt.title("Normalized x x**2, x**3 feature")
plt.plot(x,X@model_w + model_b, label="Predicted Value"); plt.xlabel("x"); plt.ylabel("y"); plt.legend(); plt.show()
Scikit-learn
接下来,我们将学习一个能实现我们所学内容的库。
sklearn.linear_model 是 scikit-learn 库中用于线性回归分析的模块。它包含了许多线性回归的模型,如线性回归,岭回归,Lasso 回归等。
SGDRegressor类实现了随机梯度下降学习,它支持不同的loss函数和正则化惩罚项来拟合线性回归模型;LinearRegression类则通过正规方程优化。
import numpy as np
import matplotlib.pyplot as plt
from sklearn.linear_model import SGDRegressor
from sklearn.preprocessing import StandardScaler
from lab_utils_multi import  load_house_data
from lab_utils_common import dlc
np.set_printoptions(precision=2)
plt.style.use('deeplearning.mplstyle')
梯度下降(Gradient descent)
#Load the data set
X_train, y_train = load_house_data()
X_features = ['size(sqft)','bedrooms','floors','age']

#Scale/normalize the training data
scaler = StandardScaler()
X_norm = scaler.fit_transform(X_train)
print(f"Peak to Peak range by column in Raw        X:{np.ptp(X_train,axis=0)}")
print(f"Peak to Peak range by column in Normalized X:{np.ptp(X_norm,axis=0)}")

#Create and fit the regression model
sgdr = SGDRegressor(max_iter=1000)
sgdr.fit(X_norm, y_train)
print(sgdr)
print(f"number of iterations completed: {sgdr.n_iter_}, number of weight updates: {sgdr.t_}")

#View parameters
b_norm = sgdr.intercept_
w_norm = sgdr.coef_
print(f"model parameters:                   w: {w_norm}, b:{b_norm}")
print( "model parameters from previous lab: w: [110.56 -21.27 -32.71 -37.97], b: 363.16")

# make a prediction using sgdr.predict()
y_pred_sgd = sgdr.predict(X_norm)
# make a prediction using w,b.
y_pred = np.dot(X_norm, w_norm) + b_norm
print(f"prediction using np.dot() and sgdr.predict match: {(y_pred == y_pred_sgd).all()}")

#Make predictions
print(f"Prediction on training set:\n{y_pred[:4]}" )
print(f"Target values \n{y_train[:4]}")

# plot predictions and targets vs original features
fig,ax=plt.subplots(1,4,figsize=(12,3),sharey=True)
for i in range(len(ax)):
    ax[i].scatter(X_train[:,i],y_train, label = 'target')
    ax[i].set_xlabel(X_features[i])
    ax[i].scatter(X_train[:,i],y_pred,color=dlc["dlorange"], label = 'predict')
ax[0].set_ylabel("Price"); ax[0].legend();
fig.suptitle("target versus prediction using z-score normalized model")
plt.show()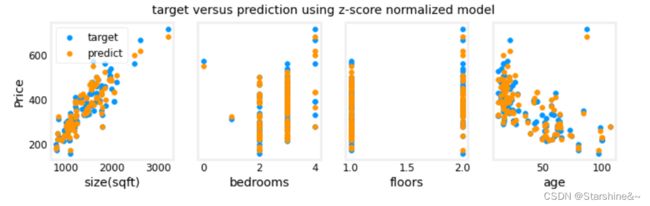
Linear Regression, closed-form solution:
![]()
![]()
加入正则项(regularization term),能控制wj的值不要太大,避免过拟合现象出现。
前面一项是为了拟合数据,正则项是为了控制wj(惩罚项),两者通过λ控制(balance both goal)。当λ等于0时,代价函数只有拟合项目,将可能造成过拟合;当λ趋于正无穷时,代价函数几乎只有正则项,此时wj趋近于零,拟合函数趋近于f(x) = b。
import numpy as np
import matplotlib.pyplot as plt
from sklearn.linear_model import LinearRegression
from lab_utils_multi import load_house_data
plt.style.use('./deeplearning.mplstyle')
np.set_printoptions(precision=2)

# load the dataset
X_train, y_train = load_house_data()
X_features = ['size(sqft)','bedrooms','floors','age']

#Create and fit the model
linear_model = LinearRegression()
linear_model.fit(X_train, y_train)

#View Parameters
b = linear_model.intercept_
w = linear_model.coef_
print(f"w = {w:}, b = {b:0.2f}")

#Make Predictions
print(f"Prediction on training set:\n {linear_model.predict(X_train)[:4]}" )
print(f"prediction using w,b:\n {(X_train @ w + b)[:4]}")
print(f"Target values \n {y_train[:4]}")

x_house = np.array([1200, 3,1, 40]).reshape(-1,4)
x_house_predict = linear_model.predict(x_house)[0]
print(f" predicted price of a house with 1200 sqft, 3 bedrooms, 1 floor, 40 years old = ${x_house_predict*1000:0.2f}")