plt.scatter()详解
plt.scatter()
一般在代码中会以下列方式导入库:import matplotlib.pyplot as plt
函数的原型:
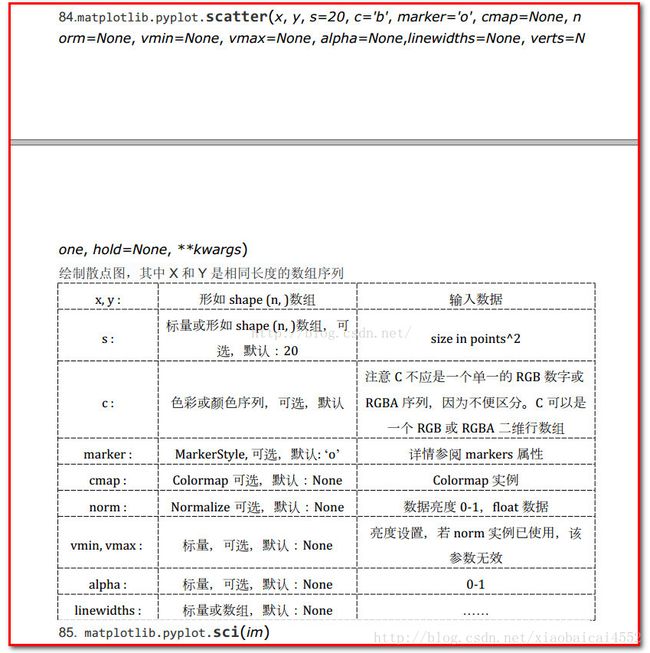
matplotlib.pyplot.scatter(x, y, s=None, c=None, marker=None, cmap=None, norm=None, vmin=None, vmax=None, alpha=None, linewidths=None, verts=None, edgecolors=None, *, data=None, **kwargs)
官方解释:A scatter plot of y vs. x with varying marker size and/or color. 也就是用根据x和y来绘制散点图。
参数解释
x,y: 表示的是大小为(n,)的数组,也就是我们即将绘制散点图的数据点,类型为float或者array。
float or array-like, shape (n, ) The data positions.
s:表示的是点的大小。是一个实数或者是一个数组大小为(n,),这个是一个可选的参数。默认20.
float or array-like, shape (n, ), optional
        The marker size in points**2.
        Default is ``rcParams['lines.markersize'] ** 2``.
c:表示的是颜色,也是一个可选项。默认是蓝色’b’,表示的是标记的颜色,或者可以是一个表示颜色的字符,或者是一个长度为n的表示颜色的序列等等,感觉还没用到过现在不解释了。但是c不可以是一个单独的RGB数字,也不可以是一个RGBA的序列。可以是他们的2维数组(只有一行)。
array-like or list of colors or color, optional
        The marker colors. Possible values:
        - A scalar or sequence of n numbers to be mapped to colors using
          *cmap* and *norm*.
        - A 2-D array in which the rows are RGB or RGBA.
        - A sequence of colors of length n.
        - A single color format string.
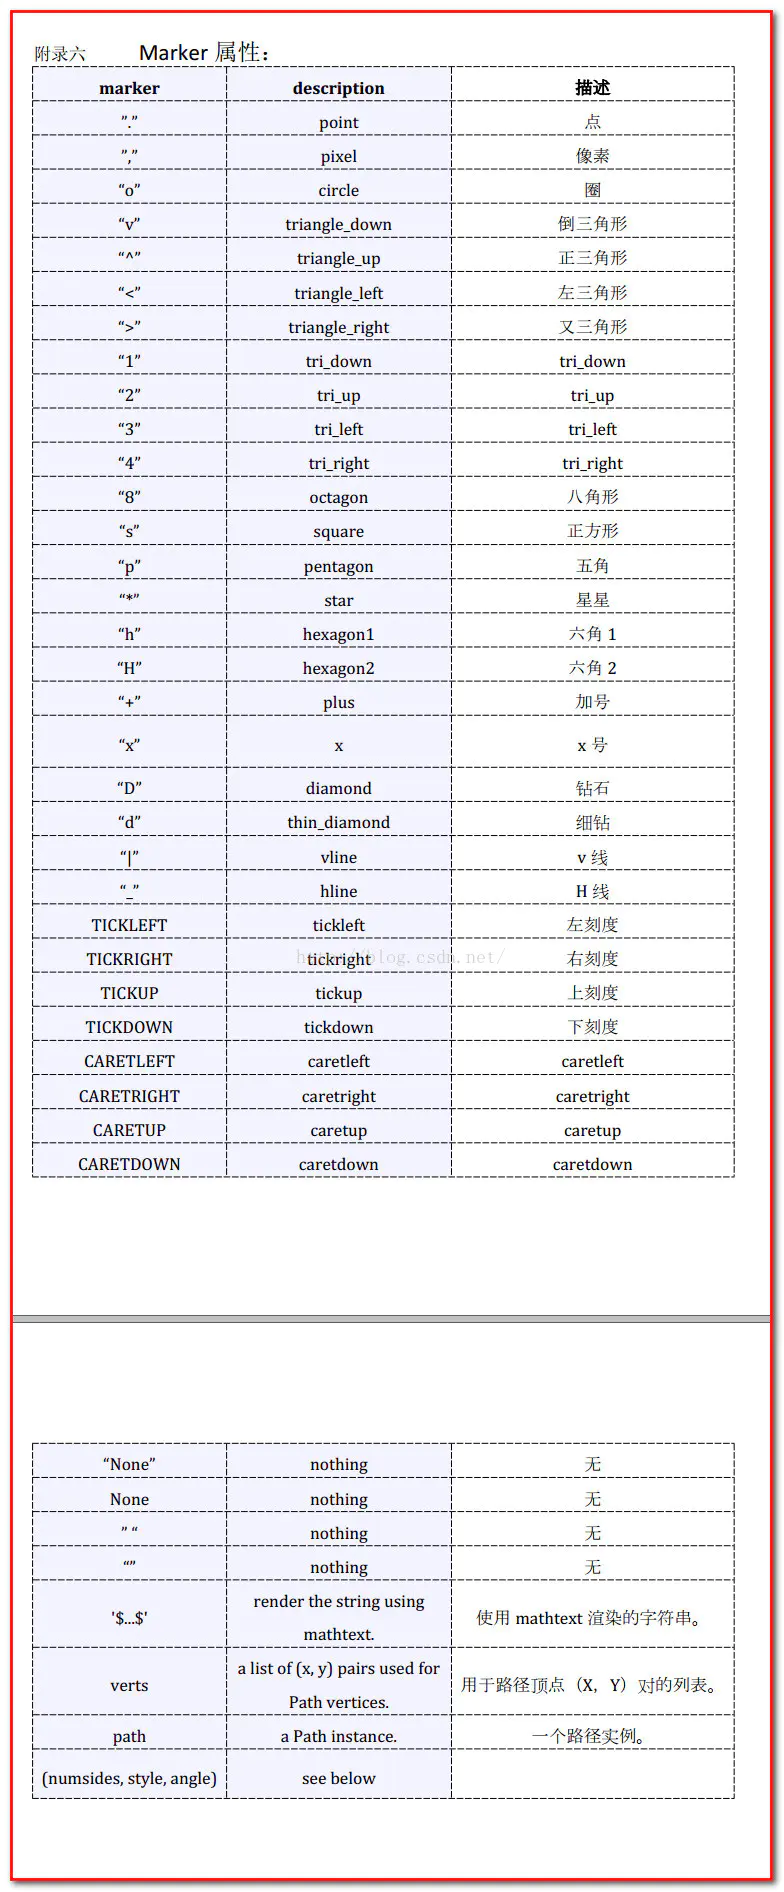
marker:表示的是标记的样式,默认的是’o’。
 `~.markers.MarkerStyle`, default: :rc:`scatter.marker`
 	The marker style. *marker* can be either an instance of the class or the text shorthand for a particular marker.
 	See :mod:`matplotlib.markers` for more information about marker styles.
cmap:Colormap实体或者是一个colormap的名字,cmap仅仅当c是一个浮点数数组的时候才使用。如果没有申明就是image.cmap
str or `~matplotlib.colors.Colormap`, default::rc:`image.cmap`
        A `.Colormap` instance or registered colormap name. *cmap* is only used if *c* is an array of floats.
norm:Normalize实体来将数据亮度转化到0-1之间,也是只有c是一个浮点数的数组的时候才使用。如果没有申明,就是默认为colors.Normalize。
`~matplotlib.colors.Normalize`, default: None
        If *c* is an array of floats, *norm* is used to scale the color data, *c*, in the range 0 to 1, in order to map into the colormap  *cmap*.
        If *None*, use the default `.colors.Normalize`.
vmin,vmax:实数,用来进行亮度数据的归一化。vmin 和 vmax 与默认范数结合使用,将颜色数组 c 映射到颜色图 cmap。 如果没有,则使用颜色数组的相应最小值和最大值。 当norm存在的时候忽略。
float, default: None
        *vmin* and *vmax* are used in conjunction with the default norm to
        map the color array *c* to the colormap *cmap*. If None, the
        respective min and max of the color array is used.
        It is deprecated to use *vmin*/*vmax* when *norm* is given.
alpha:实数,0-1之间。表示线的透明度
float, default: None
        The alpha blending value, between 0 (transparent) and 1 (opaque).
linewidths:也就是标记点的宽度。
 float or array-like, default: :rc:`lines.linewidth`
        The linewidth of the marker edges. Note: The default *edgecolors*
        is 'face'. You may want to change this as well.
散点的形状
颜色参数
用法示例
1、初始用法
import numpy as np
import matplotlib.pyplot as plt

np.random.seed(2021)   #随机数种子
x=np.random.rand(10)	#生成指定形状的随机数组,值分布在[0,1)
y=np.random.rand(10)	#也可以设置产生的形状,例如将10换成(3,2)

colors=np.random.rand(10)
area=(30*np.random.rand(10))**2   #这里设置s的大小
 								#如果s固定,那么大小一致
plt.scatter(x,y,s=area,c=colors,alpha=0.5)
plt.show()
运行结果:
2、修改代码的maker,改成钻石形状
import numpy as np
import matplotlib.pyplot as plt

np.random.seed(2021)
x=np.random.rand(10)
y=np.random.rand(10)

colors=np.random.rand(10)
area=(30*np.random.rand(10))**2

plt.scatter(x,y,s=area,c=colors,alpha=0.5,marker='D')
plt.show()
3、设置s大小不变
import numpy as np
import matplotlib.pyplot as plt

np.random.seed(2021)
x=np.random.rand(10)
y=np.random.rand(10)

colors=np.random.rand(10)

plt.scatter(x,y,s=300,c=colors,alpha=0.5,marker='D')
plt.show()
运行结果:
4、修改其中的linewidth参数的大小,看到其中的不同了吗?这里改变了maker边缘线的 宽度。注意只有marker为封闭的图案的时候,这个参数才有效!
import numpy as np
import matplotlib.pyplot as plt

np.random.seed(2021)
x=np.random.rand(10)
y=np.random.rand(10)

colors=np.random.rand(10)
area=(30*np.random.rand(10))**2
lines = np.zeros(10)+5    #返回给定形状和类型的用0填充的数组

plt.scatter(x,y,s=300,c=colors,alpha=0.5,marker='D',linewidths=lines)
plt.show()
运行结果:
文章参考:https://blog.csdn.net/m0_37393514/article/details/81298503
https://www.jianshu.com/p/1e84915c7c30


