python -- 绘制colorbar时设置标签为居中显示
python – 绘制colorbar时设置标签为居中显示
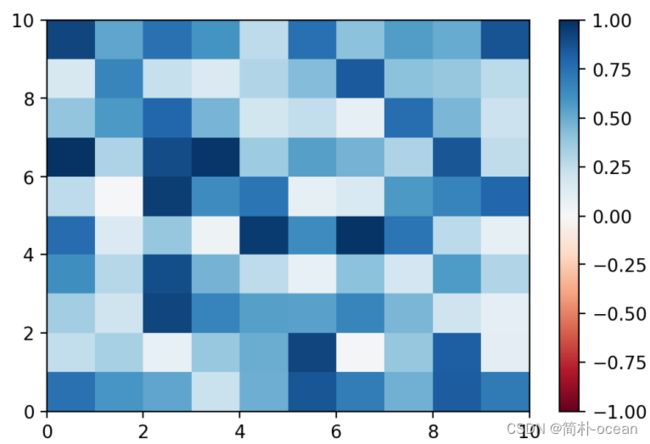
- 在海洋气象领域的相关研究中,对于一些异常信号的二维填色图绘制时,通常在设置colorbar都是以0为中心对称分布的。而在绘制colorbar时,由于存在负号会使得默认colorbar标签不太好看(强迫症的抓狂点),如下图所示:

- 为了美观显示,可以考虑将标签数值进行水平垂直居中显示。如何实现呢,主要是通过将生成的colorbar视做一个matplotlib子图的对象,然后进行位置的调整。
python相关的函数为:
ax.yaxis.set_ticklabels(ticklabels, ha='center', va='center_baseline')
ha表示水平的位置,va表示垂直的位置,设置完的结果如下下图所示:

相比之下,看起来更舒服一点。这里需要注意的是,在设置标签时,需要提前将ticks设置好,再进行居中。理论上是可以直接读取绘图时设置的levels进行设置的,但是没有仔细研究方法。
具体实现代码如下所示:
# -*- coding: utf-8 -*-
"""
Created on Fri Jun  9 15:47:02 2023

@author: jianpu

@blog :  https://blog.csdn.net/weixin_44237337?spm=1000.2115.3001.5343

@email: [email protected]

introduction : keep learning althongh walk slowly
"""

# import matplotlib.pyplot as plt

import numpy as np
import matplotlib.pyplot as plt
# 创建 5x5 的随机数组
data = np.random.rand(10,10)

# 定义 colormap 和 normalization
cmap = plt.cm.RdBu
norm = plt.Normalize(vmin=-1, vmax=1)


# 绘制 pcolormesh 图像
fig, ax = plt.subplots(dpi=200)
pcm = ax.pcolormesh(data, cmap=cmap, norm=norm)

# 添加 colorbar
cb = fig.colorbar(pcm, ax=ax)

# 设置刻度标签
ticks = [-1,-0.75, -0.5,-0.25, 0,0.25, 0.5,0.75, 1]
ticklabels = [str(val) for val in ticks]
cb.set_ticks(ticks)
cb.set_ticklabels(ticklabels)
cb.ax.yaxis.set_tick_params(pad=15, size=10)
cb.ax.yaxis.set_tick_params(which='both',direction='in',)
cb.ax.yaxis.set_ticklabels(ticklabels, ha='center', va='center_baseline')
- 当然,也有其他的弯道方法,比如将colorbar设置为水平摆放,也可以侧面解决不美观的情况。
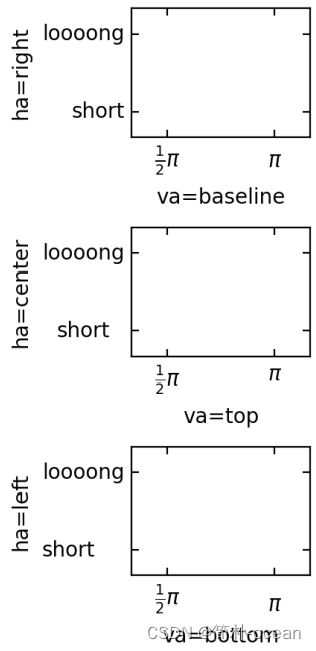
官网Ticklabel 对齐示例
下面给出一些官网对于Ticklabel 对齐方法的一些展示,代码已运行无问题

import matplotlib.pyplot as plt
import mpl_toolkits.axisartist as axisartist


def setup_axes(fig, pos):
    ax = fig.add_subplot(pos, axes_class=axisartist.Axes)
    ax.set_yticks([0.2, 0.8], labels=["short", "loooong"])
    ax.set_xticks([0.2, 0.8], labels=[r"$\frac{1}{2}\pi$", r"$\pi$"])
    return ax


fig = plt.figure(figsize=(3, 5))
fig.subplots_adjust(left=0.5, hspace=0.7)

ax = setup_axes(fig, 311)
ax.set_ylabel("ha=right")
ax.set_xlabel("va=baseline")

ax = setup_axes(fig, 312)
ax.axis["left"].major_ticklabels.set_ha("center")
ax.axis["bottom"].major_ticklabels.set_va("top")
ax.set_ylabel("ha=center")
ax.set_xlabel("va=top")

ax = setup_axes(fig, 313)
ax.axis["left"].major_ticklabels.set_ha("left")
ax.axis["bottom"].major_ticklabels.set_va("bottom")
ax.set_ylabel("ha=left")
ax.set_xlabel("va=bottom")

plt.show()
其他的一些小技巧
设置标签旋转
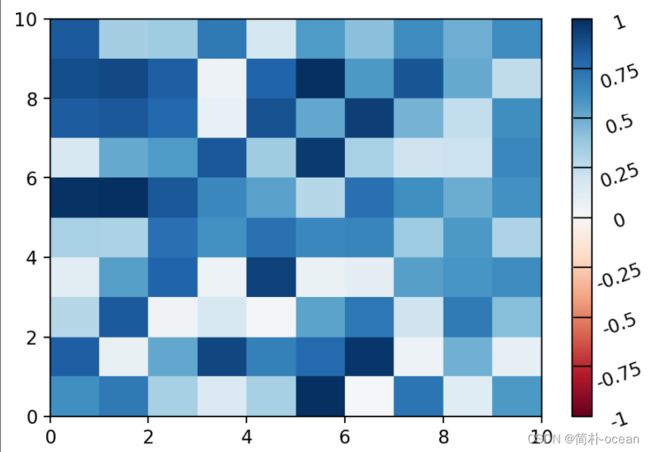
同样的,既然能设置水平,那么能不能对标签进行旋转呢?答案当然是可以的!
cb.ax.yaxis.set_ticklabels(ticklabels, ha='center', va='center_baseline',rotation=20)
- 命令更简单一点,直接设置对应的x和y的ticklabels的旋转角度即可
ax.set_xticklabels(ticklabels, rotation=45)
ax.set_yticklabels(ticklabels, rotation=45)
完整代码如下:
# -*- coding: utf-8 -*-
"""
Created on Fri Jun  9 15:47:02 2023

@author: jianpu

@blog :  https://blog.csdn.net/weixin_44237337?spm=1000.2115.3001.5343

@email: [email protected]

introduction : keep learning althongh walk slowly
"""
import numpy as np
import matplotlib.pyplot as plt
# 创建 5x5 的随机数组
data = np.random.rand(10,10)

# 定义 colormap 和 normalization
cmap = plt.cm.RdBu
norm = plt.Normalize(vmin=-1, vmax=1)
# 绘制 pcolormesh 图像
fig, ax = plt.subplots(dpi=200)
pcm = ax.pcolormesh(data, cmap=cmap, norm=norm)

# 添加 colorbar
cb = fig.colorbar(pcm, ax=ax)

# 设置刻度标签
ticks = [-1,-0.75, -0.5,-0.25, 0,0.25, 0.5,0.75, 1]
ticklabels = [str(val) for val in ticks]

ax.set_xticklabels(ticklabels, rotation=45)
ax.set_yticklabels(ticklabels, rotation=45)

cb.set_ticks(ticks)
cb.set_ticklabels(ticklabels)
cb.ax.yaxis.set_tick_params(pad=15, size=10)
cb.ax.yaxis.set_tick_params(which='both',direction='in',)
cb.ax.yaxis.set_ticklabels(ticklabels, ha='center', va='center_baseline',rotation=20)

plt.show()
设置标签水平偏移
当然,刚刚是想要达到水平垂直居中的情况,那么,能不能设置向左或者向右偏移的情况呢?
当然!
其实很简单,还是设置ha和va这两个参数就行:

ax.set_xticklabels(ticklabels, rotation=45,ha ='right')
ax.set_yticklabels(ticklabels, rotation=45,ha ='left')
ax.yaxis.set_tick_params(pad=20, size=10)
ax.xaxis.set_tick_params(pad=20, size=10)
- 这里给几个更明显直观的例子,只以设置x轴的ticklabel为例:
n=5

x = np.arange(n)
y = np.sin(np.linspace(-3,3,n))
xlabels = ['Ticklabel %i' % i for i in range(n)]

fig, axs = plt.subplots(1,3, figsize=(12,3),dpi=200)

ha = ['right', 'center', 'left']

for n, ax in enumerate(axs):
    ax.plot(x,y, 'o-')
    ax.set_title(ha[n])
    ax.set_xticks(x)
    ax.set_xticklabels(xlabels, rotation=40, ha=ha[n], rotation_mode='anchor')
当然,也可以换个思路,即可标签太多了放不下,那么我就分层次的放置:
import numpy as np
n=5

x = np.arange(n)
y = np.sin(np.linspace(-3,3,n))
xlabels = ['Long ticklabel %i' % i for i in range(n)]


fig, ax = plt.subplots(1,3, figsize=(15,6),dpi=200)
ha = ['right', 'center', 'left']

for n, ax in enumerate(ax):
    ax.plot(x,y, 'o-')
    ax.set_title(ha[n])
    ax.set_xticks(x)
    labels=ax.set_xticklabels(xlabels, rotation=0, ha=ha[n])
    for i, label in enumerate(labels):
        label.set_y(label.get_position()[1] - (i % 2) * 0.075)
总之来说,方法总比困难多,萝卜青菜,各有所爱。大家可以按照个人喜好设置!当然也欢迎分享更多简单有意思的方法~
引用参考:
https://stackoverflow.com/questions/14852821/aligning-rotated-xticklabels-with-their-respective-xticks
https://matplotlib.org/stable/gallery/axisartist/demo_ticklabel_alignment.html


