CD用户消费数据分析
项目来自网络
附数据集
1.数据载入和探索
1.1 数据加载
import numpy as np
import pandas as pd

%matplotlib inline
import matplotlib.pyplot as plt
df = pd.read_csv('./CDNOW_master.csv', names = ['user_id', 'order_dt', 'order_products', 'order_amount'], sep='\s+')
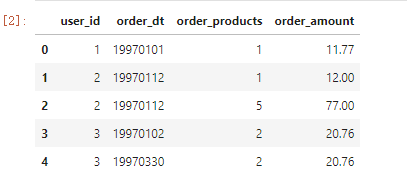
df.head()
- user_id:用户id
- order_dt:每笔订单成交的时间日期
- order_products:每笔订单用户的购买数量
- order_amount:每笔订单的消费金额
1.2 数据探索
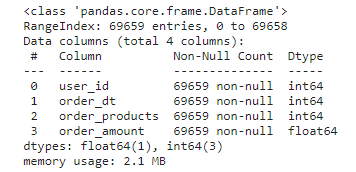
df.info()
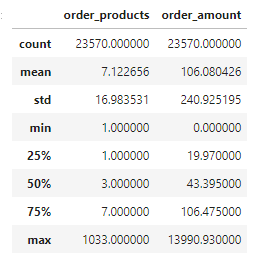
df.describe()

从上述描述性统计可以得知,order_products的平均数在中位数和Q3之间,说明大部分人购买的产品数量都不多,order_products受最大值影响;order_amount和order_products相同,大部分人购买的金额都不高,受最大值影响,order_amount有最小值0,考虑到在促销等活动期间存在0消费的白嫖可能性,当作正常数据处理
2. 每月用户总体消费趋势分析
df.order_dt = pd.to_datetime(df.order_dt, format = '%Y%m%d')
df['month'] = df.order_dt.astype('datetime64[M]')
fig, ax = plt.subplots(2, 2, figsize=(15,10))

df.order_amount.groupby(df.month).sum().plot(ax = ax[0][0], title = '总销售额')

df.user_id.groupby(df.month).count().plot(ax = ax[0][1], title = '每月订单数量')

df.order_products.groupby(df.month).sum().plot(ax = ax[1][0], title = '每月消费商品数量')

df.groupby('month').user_id.apply(lambda x:len(x.unique())).plot(ax = ax[1][1], title = '每月用户数量')

plt.tight_layout() # 设置子图的间距

plt.show()

四个折线图的趋势基本一致,可以看出来,1997年前3个月的总销售额特别高,在3月份之后骤然下降,接近平稳。推测也许是前三个月网站正在进行周年庆促销活动,促进了新用户的增长和消费,在活动之后恢复正常,随后的7月和11月有个小高峰,是618(京东笑)和双11的原因吗?
另一方面,在2月到3月这段期间,可以发现消费人数稍有下降,但总销量与总销售额却依然有所上升,是极值影响还是有高价值用户?
pd.pivot_table(df, index = ['month'],
               values = ['user_id', 'order_amount', 'order_products'],
               aggfunc = {'user_id': 'count', 'order_amount': 'sum', 'order_products': 'sum'}).head()
3. 用户个体消费情况分析
3.1 用户消费金额,消费次数的描述统计
grouped_user = df.groupby('user_id')
grouped_user.sum().describe()
- 用户平均购买了7张cd,大于Q3,说明小部分用户购买了大量的CD
- 用户平均消费106元,接近Q3,同样说明有小部分用户巨额消费
3.2 用户消费金额和销量的关系
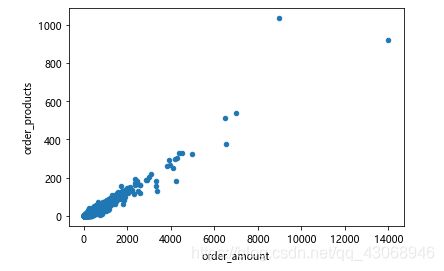
grouped_user.sum().plot.scatter(x = 'order_amount', y = 'order_products')

plt.show()
- 大部分用户行为都是呈线性规律的,只有少量极值。
# 过滤极值点
grouped_user.sum().query('order_amount< 6000').plot.scatter(x = 'order_amount', y = 'order_products')

plt.show()
3.3 用户消费金额分布
# 用户消费金额
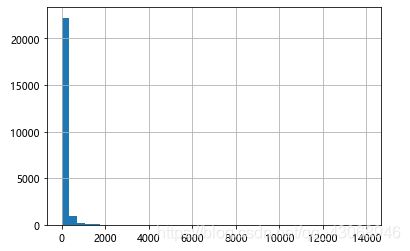
grouped_user.order_amount.sum().hist(bins = 40)

plt.show()
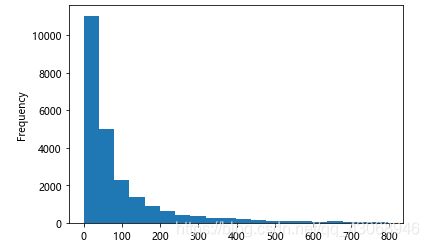
- 从直方图可以看出,用户消费金额,绝大部分呈现集中趋势,小部分异常值干扰了判断,可以使用过滤操作排除异常
grouped_user.sum().query("order_amount < 800").order_amount.plot.hist(bins=20)

plt.show()
3.4 用户消费次数分布
# 用户消费金额
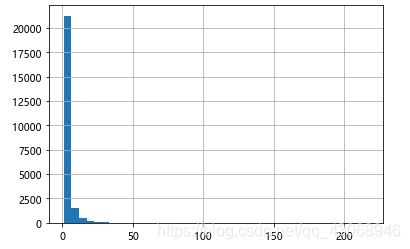
grouped_user.order_amount.sum().hist(bins = 40)

plt.show()
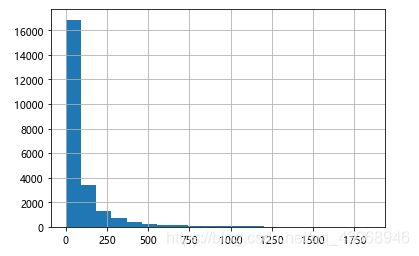
# 根据切比雪夫定理过滤极值点
grouped_user.sum().query('order_products < 92').order_amount.hist(bins=20)

plt.show()
3.5 用户累计消费金额占比
# cunsum(),累加
user_amount = grouped_user.sum().sort_values('order_amount').apply(lambda x: x.cumsum() / x.sum() )
user_amount.reset_index().order_amount.plot()

plt.show()
- 从图中看出,前20000名用户贡献了40%的消费,而后3500名用户贡献了60%的消费。
4、用户消费行为分析
4.1 用户第一次消费(首购)
grouped_user.order_dt.min().value_counts().plot()

plt.show()
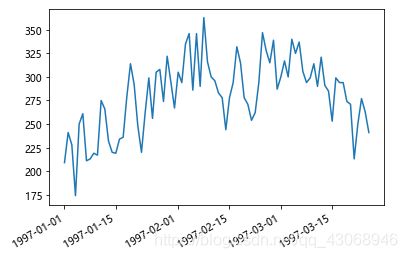
- 用户第一次购买分布,集中在前三个月,其中2月11日至2月25日有一次剧烈波动
4.2 用户最后一次消费
grouped_user.order_dt.max().value_counts().plot()

plt.show()
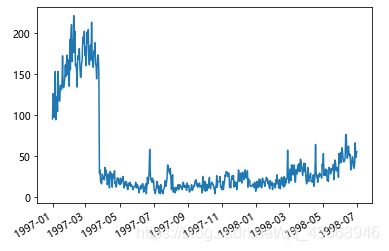
- 用户的最后一次消费比首购分布广,大部分用户最后一次消费集中在前三个月,3月份之后有明显的下降,说明很多用户购买一次后就不再购买,客户的留存率不高。
4.3 多少用户仅消费了一次? (一天内消费多次记作一次)
# 消费一次的用户
user = grouped_user.order_dt.agg(['min', 'max']).reset_index()
one_buy = (user['min'] == user['max']).value_counts().values

plt.pie(one_buy, autopct = '%1.1f%%', explode = [0.1,0])

plt.axis('equal')
plt.legend(["仅消费一次", "消费多次"])

plt.show()
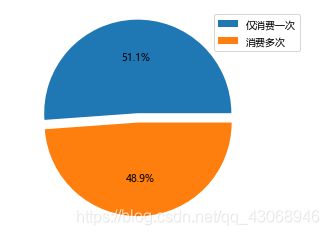
- 首购比老顾客还多2.2%,运营的不好留不住新顾客
4.4 用户分层
4.4.1 按用户价值分层—RFM模型
rfm = df.pivot_table(index = 'user_id',
                    values = ['order_products','order_amount','order_dt'],
                    aggfunc = {'order_dt':'max',
                              'order_amount':'sum',
                              'order_products':'sum'
                             })
"""rfm客户模型:
    R,最近一次消费(最后一次消费 - 数据中时间的最大值);
    F,消费频率;
    M,消费金额
"""
rfm['R'] = abs(rfm.order_dt - rfm.order_dt.max()) / np.timedelta64(1, 'D') # 最后一次消费时间的值是 xxDay的datetime格式,用/ 1Day的方式去除
rfm.rename(columns = {'order_products':'F','order_amount':'M'},inplace = True)

def rfm_func(x):
    level = x.apply(lambda x:'1' if x>=1 else '0')
    label = level.R +level.F +level.M
    d = {
        '111':'重要价值客户',
        '011':'重要保持客户',
        '101':'重要发展客户',
        '001':'重要挽留客户',
        '110':'一般价值客户',
        '010':'一般保持客户',
        '100':'一般发展客户',
        '000':'一般挽留客户',
    }
    result = d[label]
    return result

rfm['label'] = rfm[['R','F','M']].apply(lambda x:x-x.mean()).apply(rfm_func,axis=1).
rfm.head()
rfm.loc[rfm.label == '重要价值客户', 'color'] = 'g'
rfm.loc[~(rfm.label == '重要价值客户'), 'color'] = 'r'

rfm.plot.scatter('F','R',c=rfm.color)

plt.show()
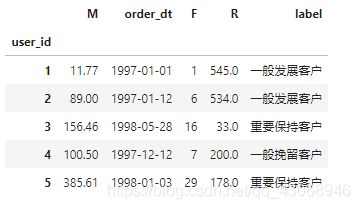
- 从RFM 分层可知,大部分用户为重要保持客户,但是这是由于极值的影响,所以RFM的划分标准应该以业务为准
4.4.2 按用户活跃程度分层—用户生命周期
# 每月的用户状态
pivoted_counts = df.pivot_table(index = 'user_id',
                              columns =  'month',
                               values = 'order_dt',
                              aggfunc = 'count').fillna(0)
pivoted_counts
# 当月有消费记为1,没有消费记为0
df_purchase = pivoted_counts.applymap(lambda x: 1 if x > 0 else 0)
df_purchase
def active_status(data):
    status = []
    for i in range(len(pivoted_counts.columns.values.tolist())):
        if data[i] == 0:
            if len(status)>0:
                if status[i-1] == 'unreg':
                    status.append('unreg')
                else:
                    status.append('unactive')
            else:
                status.append('unreg')

        # 若本月消费
        else:
            if len(status) == 0:
                status.append('new')
            else:
                if status[i-1] == 'unactive':
                    status.append('return')
                elif status[i-1] == 'unreg':
                    status.append('new')
                else:
                    status.append('active')
    return status
说明:
若本月没有消费
若之前是未注册,则依旧为未注册(unreg)
若之前有消费,则为流失/不活跃(unactive)
其他情况,为未注册(unreg)
若本月有消费
若是第一次消费,则为新用户(new)
如果之前有过消费,则上个月不活跃,则为回流(return)
如果上个月为未注册,则为新用户(new)
除此外,为活跃(active)
purchase_stats= df_purchase.apply(active_status,axis=1)

purchase_stats = purchase_stats.apply(pd.Series)
purchase_stats.columns = pivoted_counts.columns
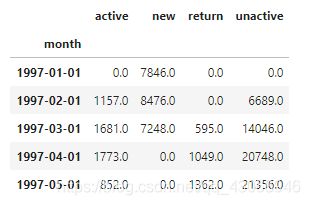
purchase_stats.head()
# 将unreg替换为空值,以便后续计算回购率、复购率
# 计算每个月各种状态的计数
purchase_stats_ct=purchase_stats.replace('unreg',np.NaN).apply(lambda x: pd.value_counts(x))
purchase_stats_ct.fillna(0).T.head()
purchase_stats_ct.fillna(0).T.apply(lambda x:x/x.sum(),axis = 1)

purchase_stats_ct.fillna(0).T.plot.area(figsize = (12,8))
plt.show()
- 用面积图表示出来更加的清晰明了。
purchase_stats_ct.fillna(0).T.apply(lambda x:x/x.sum(),axis = 1)
- 活跃用户:比例持续下降,说明持续消费的用户数量在减少,也说明运营部门的促活效果并不好。
- 回流用户:比例也稍有下降,在4%左右波动。
- 不活跃用户:比例稍有上升,流失较大。
4.5 用户购买周期(按订单)
# 用户的每次购买时间间隔。
order_diff = df.groupby('user_id').apply(lambda x: x['order_dt'] - x['order_dt'].shift())
order_diff.head(10)
order_diff.describe()
- 平均每个用户的购买时间间隔是68天,间隔最长的是533天。
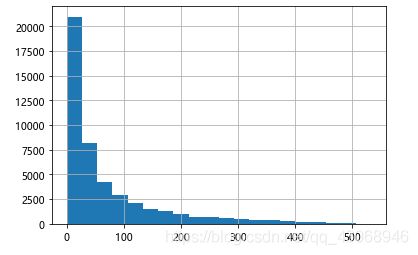
(order_diff / np.timedelta64(1, 'D')).hist(bins = 20)

plt.show()
- 用户消费周期呈长尾分布。
- 绝大部分用户的消费周期都低于100天
4.6 用户生命周期
(user['max'] - user['min']).describe()
- 大部分的用户生命周期都是0天(说明只消费了一次),平均值是134天。
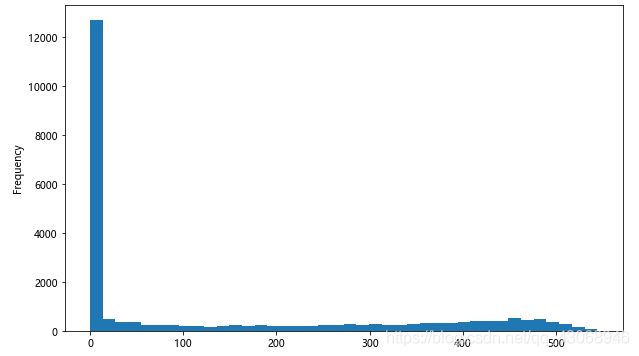
((user['max'] - user['min']) / np.timedelta64(1,'D') ).plot.hist(bins=40,figsize=(10,6))

plt.show()
- 用户的生命周期受只够买1次的用户影响较大,可以排除后再看看。
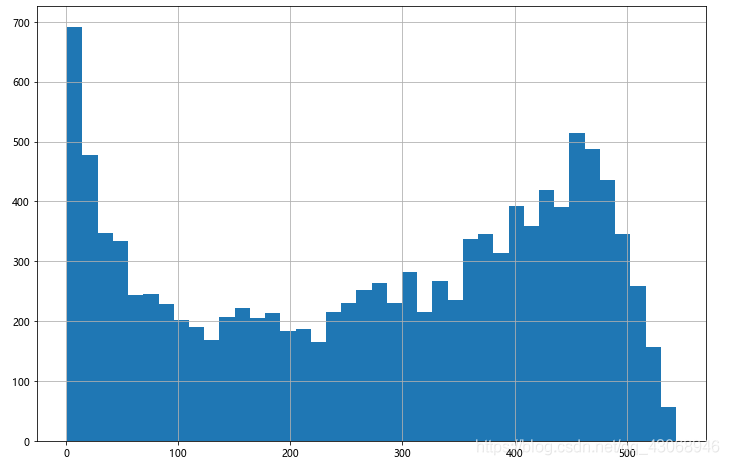
u = ((user['max'] - user['min']).reset_index()[0] / np.timedelta64(1,'D'))
u[u > 0].hist(bins=40, figsize = (12, 8))

plt.show()
- 现在可以看出,数据称双峰分布,两个峰值分别集中在50以内和400-500。
5. 复购率和回购率分析
5.1 复购率
# 复购率,自然月内,购买多次的用户占比,再次购买人数/总购买人数
"""0:没有买,1:买了1次,大于1:复购"""
pivoted_counts.head()
# np.NaN if x==0 没有买,计算用不上,赋空值;else 0 买了一次,算在总购买人数中,赋值 0;1 if x>1 大于1,多次购买

purchase_r=pivoted_counts.applymap(lambda x: 1 if x>1 else np.NaN if x==0 else 0)
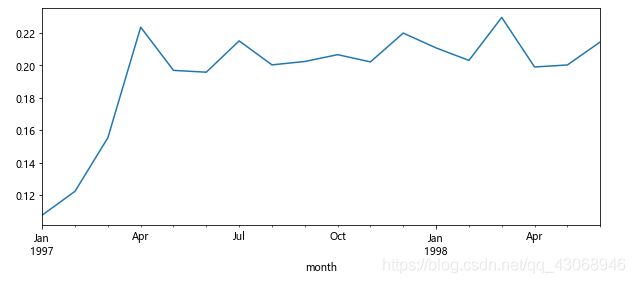
(purchase_r.sum()/purchase_r.count()).plot(figsize=(10,4))

plt.show()
- 前三个月由于大量新用户的涌入,而这批用户仅消费了一次,导致复购率较低。后期剩下都是老用户,复购率稳定在20%左右。
5.2 回购率
# 回购率 只需要0  1 代表
data_purchase.head()
def purchase_back(data):
    status=[]
    for i in range(17):
        if data[i]==1: # 本月进行过消费
            if data[i+1]==1:# 下一月是否进行消费
                status.append(1) #消费为1 回购了
            if data[i+1]==0:
                status.append(0) # 未消费则为0 没有回购
        else:
            status.append(np.NaN) # 之前没消费则不计
    status.append(np.NaN) # 最后一个月没有判断需要补上
    return pd.Series (status,index= df.groupby('month').sum().reset_index().month)
purchase_b = df_purchase.apply(purchase_back,axis= 1)
purchase_b.head()
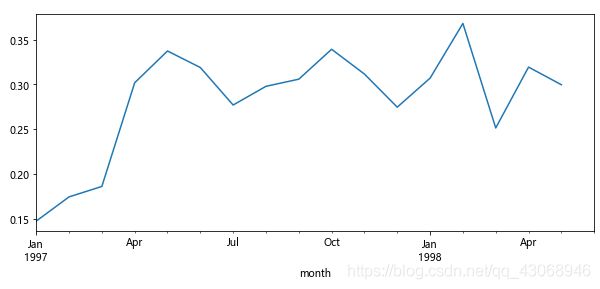
(purchase_b.sum()/purchase_b.count()).plot(figsize=(10,4))

plt.show()
- 回购率在30%左右波动,比复购率要高,综合分析得出,新客整体质量低于老客,老客忠诚度(回购率)表现较好,消费频次稍次
