【头歌-Python】9.2 能带曲线绘制(project) 第1~3关
第1关:能带曲线绘制一
任务描述
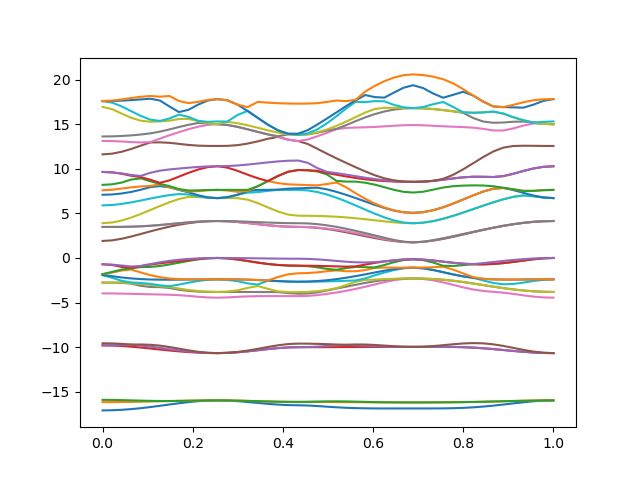
本关任务:使用matplotlib绘制图形。
相关知识
为了完成本关任务,你需要掌握:
- 使用 matplotlib 绘制图形
- python 读取文件
python 读取文件
python读取文件可以用以下函数实现:
# 读文件,根据制表符'\t'将每行数据切分为列表再加入到列表中
def read_file(file):
    """
    @参数 file:文件名,字符串
    读文件,根据制表符'\t'将每行数据切分为列表再加入到列表中将数据映射为浮点数类型。
    返回值为二维列表,其中数据是浮点数类型。
    """
    with open(file, 'r', encoding='utf-8') as file:
        data_list = [list(map(float, line.strip().split('\t'))) for line in file]
    return data_list
编程要求
- 数据下载:
band.txt - 根据提示,在右侧编辑器补充代码,绘制图形,具体要求如下:
- 绘制能带曲线图,线条颜色、粗细由系统默认,均为实线。
- 文件中的能带曲线数据有 2 列,分别代表坐标的(x, y)值。整个文件中的数据分为多组,每组数据 x 值范围从 0 增加到 1.0,每组数据可以绘制一条能带曲线。
- 重复读取各组数据,便可以绘制全部的能带曲线了。
- 绘制结果写入到文件"result/result.jpg"中
测试说明
参考代码
import matplotlib.pyplot as plt

def read_file(file):
    """参数文件名读文件,根据制表符'\t'将每行数据切分为列表再加入到列表中将数据映射为浮点数类型。
    返回值为二维列表。 """
    with open(file, 'r', encoding='utf-8') as f:
    	res = []
        for line in f.readlines():
            res.append(line.strip().split('\t'))
    	return res

def plot_band(band_data):
    """参数数据是二维列表,x值从0-1的变化数据为一组,分组读取数据并绘制全部曲线"""
    x, y = [], []
    for data in band_data:
        x.append(eval(data[0]))
        y.append(eval(data[1]))
        if data[0] == '1':
            plt.plot(x, y)
            x, y = [], []

if __name__ == '__main__':
    filename = 'band.txt'
    data = read_file(filename)        # 读文件到二维列表
    plot_band(data)                 # 调用函数绘制曲线
    plt.savefig("result/result.jpg")  # 保存成图片
    plt.show()
第2关:能带曲线绘制二
任务描述
本关任务:使用matplotlib绘制图形。
相关知识
为了完成本关任务,你需要掌握:
- 显示中文;
- python 读取文件
- 使用 matplotlib 绘制图形;
显示中文
设置中文字体和负号显示问题如下:
plt.rcParams['font.sans-serif'] = ['SimSun']
plt.rcParams['axes.unicode_minus'] = False
python 读取文件
python读取文件可以用以下函数实现:
# 读文件,根据制表符'\t'将每行数据切分为列表再加入到列表中
def read_file(file):
    """读文件file,根据制表符'\t'将每行数据切分为列表再加入到列表中将数据映射为浮点数类型。
    返回值为二维列表,其中数据是浮点数类型。
    """
    with open(file, 'r', encoding='utf-8') as file:
        data_list = [list(map(float, line.strip().split('\t'))) for line in file]
    return data_list
或先以字符串形式加入列表,使用再转为数值:
def read_file(file):
    """读文件file,根据制表符'\t'将每行数据切分为列表再加入到列表中。返回值为二维列表,其中数据是字符串类型。 """
    with open(file, 'r', encoding='utf-8') as file:
        data_list = [line.strip().split('\t') for line in file]
    return data_list
编程要求
根据提示,在右侧编辑器 Begin-End 区间中补充代码,绘制图形,具体要求如下:
-
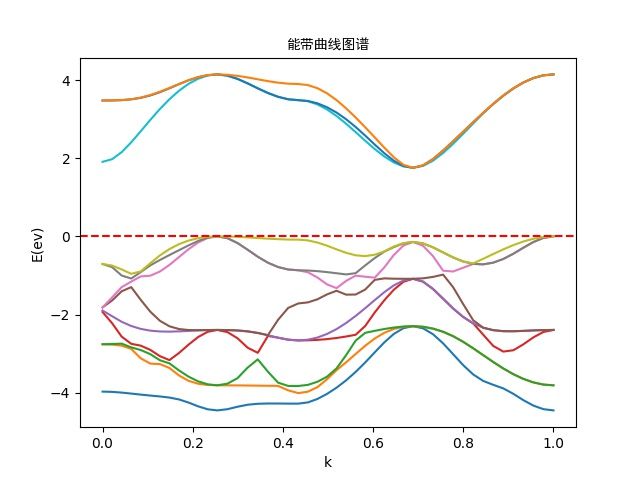
一般来说,费米面附近的能带对性质影响最大,所以科学家只关心纵坐标为0的直线附近的能带曲线,用户输入用空格分隔的两个浮点数,用于确定一个纵坐标为 0 附近的区间,绘制纵坐标这个区间之间的能带曲线,
-
加图名“能带曲线图谱”,字体为’SimSun’,横坐标标签“k”,纵坐标标签“E(ev)”,在 y=0 处绘制一条直线,线型为虚线,红色。例如用户输入-5.0 5.0,绘制如下图形,相当于将处于这个区间的图形纵向拉伸放大,使曲线的弯曲程度更明显。
测试说明
平台会对你编写的代码进行测试:
- 输入示例:
-5.0 5.0
参考代码
import matplotlib.pyplot as plt

plt.rcParams['font.sans-serif'] = ['SimSun']
plt.rcParams['axes.unicode_minus'] = False

def read_file(file):
    """参数文件名读文件,根据制表符'\t'将每行数据切分为列表再加入到列表中将数据映射为浮点数类型。
    返回值为二维列表。 """
    with open(file, 'r', encoding='utf-8') as f:
    	res = []
        for line in f.readlines():
            res.append(line.strip().split('\t'))
    	return res

def plot_band(band_data, m, n):
    """参数数据是二维列表,x值从0-1的变化数据为一组,分组读取数据并绘制全部曲线"""
    x, y = [], []
    for data in band_data:
        x.append(eval(data[0]))
        y.append(eval(data[1]))
        if data[0] == '1':
            if len([i for i in y if not m<=i<=n])==0:
            	plt.plot(x, y)
            x, y = [], []

def plot_label():
    """绘制坐标标签、图名与x轴"""
    plt.axhline(0, linestyle='--', color='r')
    plt.title('能带曲线图谱')
    plt.xlabel('k')
    plt.ylabel('E(ev)')

if __name__ == '__main__':
    filename = 'band.txt'
    data = read_file(filename)  # 读文件到二维列表
    min_value, max_value = map(float, input().split())  # 输入数据范围
    if min_value > max_value:
        min_value, max_value = max_value, min_value
    plot_band(data, min_value, max_value)  # 调用函数绘制曲线
    plot_label()
    plt.savefig("result/result.jpg")  # 保存成图片
    plt.show()
第3关:能带曲线绘制(拓展)
任务描述
本关任务:使用 matplotlib 绘制图形。
相关知识
为了完成本关任务,你需要掌握:
- 使用 matplotlib 绘制图形;
- python 读取文件。
python 读取文件
python读取文件可以用以下函数实现:
# 读文件,根据制表符'\t'将每行数据切分为列表再加入到列表中
def read_file(file):
    """
    @参数 file:文件名,字符串
    读文件,根据制表符'\t'将每行数据切分为列表再加入到列表中将数据映射为浮点数类型。
    返回值为二维列表,其中数据是浮点数类型。
    """
    with open(file, 'r', encoding='utf-8') as file:
        data_list = [list(map(float, line.strip().split('\t'))) for line in file]
    return data_list
编程要求
根据提示,在右侧补充代码,绘制图形,具体要求如下:
-
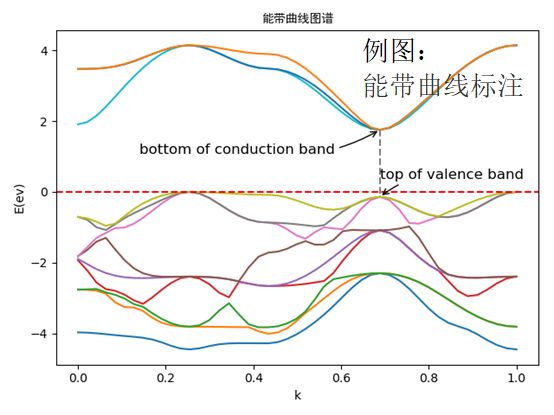
找出纵坐标大于0的曲线上的最低点A的坐标,标注该点为“bottom of conduction band”。
-
找出纵坐标小于0的曲线上、与A点相同横坐标的最高点B的坐标,标注该点为“top of valence band”。
-
计算并输出A、B之间的距离(A,B横坐标相同),用灰色虚线连接A,B两点。输出导带底坐标、价带顶坐标和带隙。
测试说明
平台会对你编写的代码进行测试:
参考代码
import matplotlib.pyplot as plt

plt.rcParams['font.sans-serif'] = ['SimSun']
plt.rcParams['axes.unicode_minus'] = False

def read_file(file):
    """参数文件名读文件,根据制表符'\t'将每行数据切分为列表再加入到列表中将数据映射为浮点数类型。
    返回值为二维列表。 """
    with open(file, 'r', encoding='utf-8') as f:
    	res = []
        for line in f.readlines():
            res.append(line.strip().split('\t'))
    	return res

def plot_band(band_data, m, n):
    """参数数据是二维列表,x值从0-1的变化数据为一组,分组读取数据并绘制全部曲线"""
    x, y = [], []
    for data in band_data:
        x.append(eval(data[0]))
        y.append(eval(data[1]))
        if data[0] == '1':
            if len([i for i in y if not m<=i<=n])==0:
            	plt.plot(x, y)
            x, y = [], []

def bottom_top_band(data_list):
    """参数是浮点数的二维列表,定位导价底和价带顶的坐标。导带底为纵坐标大于0的部曲线最低点,
    价带顶为纵坐标小于0 的曲线最高点,一般导带底与价带顶相对,即横坐标相同。以元组形式返回导带底坐标和价带顶坐标 """
    Min = (0, 1000)
    for data in data_list:
        d = eval(data[1])
        if 0<d<Min[1]:
            Min = (data[0], d)

    Max = max([eval(d[1]) for d in data_list if d[0]==Min[0] and eval(d[1])<0])
    return (eval(Min[0]), Min[1]), (eval(Min[0]), Max)

def gap_of_band(bottom, top):
    """bottom纵坐标大于0的部曲线最低点坐标;top纵坐标小于0 的曲线最高点坐标
    接收导带底和价带顶的数值,带隙为导带底和价带顶纵坐标之差,返回带隙值。 """
	return #该函数在本题中似乎没有用

def mark_peak(bottom_top):
    """绘制注释,在y值大于0的部分找到曲线最低点,标注'bottom of conduction band'
    在y值小于0的部分找到曲线最高点,标注'top of valence band'。 绘制导带底到价带顶连线,灰色破折线 """
    plt.plot([bottom_top[0][0], bottom_top[1][0]], [bottom_top[0][1], bottom_top[1][1]], linestyle='--', color='gray')
    plt.annotate(r'bottom of conduction band', xy=bottom_top[0], xytext=(-200, -20),
                 textcoords='offset points', fontsize=12,
                 arrowprops=dict(arrowstyle="->", connectionstyle="arc3,rad=.2"))
    plt.annotate(r'top of valence band', xy=bottom_top[1], xytext=(0, 15),
                 textcoords='offset points', fontsize=12,
                 arrowprops=dict(arrowstyle="->", connectionstyle="arc3,rad=.2"))

def plot_label():
    """绘制坐标标签、图名与x轴"""
    plt.axhline(0, linestyle='--', color='r')
    plt.title('能带曲线图谱')
    plt.xlabel('k')
    plt.ylabel('E(ev)')

if __name__ == '__main__':
    filename = 'band.txt'
    data = read_file(filename)  # 读文件到二维列表
    min_value, max_value = map(float, input().split())  # 输入数据范围
    if min_value > max_value:
        min_value, max_value = max_value, min_value
    plot_band(data, min_value, max_value)  # 调用函数绘制曲线
    bottom_to_top = bottom_top_band(data)
    mark_peak(bottom_to_top)
    plot_label()
    bottom_top_band(data)
    plt.savefig("result/result.jpg")  # 保存成图片
    plt.show()


