【计算机视觉 | 分割】SAM 升级版:HQ-SAM 的源代码测试(含测试用例)
文章目录
- 一、第一段代码
- 二、第二段代码
- 三、第三段代码
-
- 3.1 函数1
- 3.2 函数2
- 3.3 函数3
- 3.4 函数4
- 3.5 函数5
- 四、第四段代码
- 五、第五段代码
-
- 5.1 测试用例1
- 5.2 测试用例2
- 5.3 测试用例3
- 5.4 测试用例4
- 5.5 测试用例5
- 5.6 测试用例6
- 5.7 测试用例7
- 5.8 测试用例8
下面是一个测试用例,会逐一解读代码:
一、第一段代码
import os
import numpy as np
import torch
import matplotlib.pyplot as plt
import cv2

print("PyTorch version:", torch.__version__)
print("CUDA is available:", torch.cuda.is_available())

!git clone https://github.com/SysCV/sam-hq.git
os.chdir('sam-hq')
!export PYTHONPATH=$(pwd)
from segment_anything import sam_model_registry, SamPredictor
- 导入库:
os:提供与操作系统交互的函数。
numpy(导入为 np):一个用于数值计算的Python库。
torch:主要用于使用PyTorch,一个流行的深度学习框架的库。
matplotlib.pyplot(导入为 plt):用于绘制图表和可视化数据的库。
cv2:OpenCV库,用于计算机视觉任务,如图像处理和计算机视觉算法。
- 打印PyTorch版本和CUDA的可用性:
PyTorch版本可以通过torch.__version__获得,而torch.cuda.is_available()则判断CUDA是否可用。
- 克隆GitHub仓库:
使用Git克隆了一个名为 “sam-hq” 的GitHub仓库。!git clone 表示执行命令行命令来克隆仓库。然后使用os.chdir()将当前工作目录更改为 “sam-hq”。
- 设置PYTHONPATH环境变量:
export 命令用于设置环境变量,$(pwd) 返回当前目录的路径。
- 导入自定义模块:
从 “segment_anything” 模块中导入了 sam_model_registry 和 SamPredictor。这些模块可能是自定义的,位于 “sam-hq” 仓库中的 “segment_anything” 文件夹中。
二、第二段代码
!mkdir pretrained_checkpoint
!wget https://huggingface.co/lkeab/hq-sam/resolve/main/sam_hq_vit_l.pth
!mv sam_hq_vit_l.pth pretrained_checkpoint
使用命令行命令mkdir在当前工作目录下创建一个名为 “pretrained_checkpoint” 的目录。
使用命令行命令wget从指定的URL下载文件。在这里,它从 https://huggingface.co/lkeab/hq-sam/resolve/main/sam_hq_vit_l.pth 下载文件。
使用命令行命令mv将文件 “sam_hq_vit_l.pth” 移动到 “pretrained_checkpoint” 目录下。mv命令接受两个参数,第一个参数是要移动的文件名,第二个参数是目标目录的路径。
综合起来,这部分代码的作用是在当前工作目录下创建 “pretrained_checkpoint” 目录,并从指定URL下载文件 “sam_hq_vit_l.pth”,然后将该文件移动到 “pretrained_checkpoint” 目录下。
三、第三段代码
3.1 函数1
def show_mask(mask, ax, random_color=False):
    if random_color:
        color = np.concatenate([np.random.random(3), np.array([0.6])], axis=0)
    else:
        color = np.array([30/255, 144/255, 255/255, 0.6])
    h, w = mask.shape[-2:]
    mask_image = mask.reshape(h, w, 1) * color.reshape(1, 1, -1)
    ax.imshow(mask_image)
这行代码定义了一个名为 show_mask 的函数,它接受三个参数:
- mask:一个表示遮罩(mask)的数组。
- ax:用于绘制遮罩的 Matplotlib 的轴对象(axes object)。
- random_color(默认为 False):一个布尔值,指示是否使用随机颜色绘制遮罩。
根据 random_color 参数的值选择颜色。如果 random_color 为 True,则生成一个随机颜色,否则使用默认颜色。随机颜色是一个包含三个随机数和一个固定值的数组,而默认颜色是一个预定义的颜色(蓝色)。
将遮罩数组变换成一个与之对应的遮罩图像,并使用颜色数组对遮罩图像进行着色。最后,使用 Matplotlib 的 imshow 函数在指定的轴对象上显示遮罩图像。
综合起来,这个函数的目的是将给定的遮罩数组转换为可视化的遮罩图像,并将其显示在指定的 Matplotlib 轴对象上。
3.2 函数2
def show_points(coords, labels, ax, marker_size=375):
    pos_points = coords[labels==1]
    neg_points = coords[labels==0]
    ax.scatter(pos_points[:, 0], pos_points[:, 1], color='green', marker='*', s=marker_size, edgecolor='white', linewidth=1.25)
    ax.scatter(neg_points[:, 0], neg_points[:, 1], color='red', marker='*', s=marker_size, edgecolor='white', linewidth=1.25)
这行代码定义了一个名为 show_points 的函数,它接受四个参数:
- coords:一个包含点坐标的数组。
- labels:一个包含对应点标签的数组。
- ax:用于绘制点的 Matplotlib 的轴对象(axes object)。
- marker_size(默认为 375):指定点标记的大小。
根据点的标签将点分为正样本和负样本。它使用布尔索引从 coords 和 labels 数组中选择正样本和负样本。
使用 Matplotlib 的 scatter 函数在指定的轴对象上绘制点。它分别绘制了正样本和负样本的点。正样本用绿色表示,负样本用红色表示。marker=‘*’ 指定了点的标记形状为星号,s=marker_size 指定了点的大小,edgecolor=‘white’ 和 linewidth=1.25 设置了点的边缘颜色和边缘宽度。
综合起来,这个函数的目的是根据给定的点坐标和标签在指定的 Matplotlib 轴对象上绘制正样本和负样本的点。
3.3 函数3
def show_box(box, ax):
    x0, y0 = box[0], box[1]
    w, h = box[2] - box[0], box[3] - box[1]
    ax.add_patch(plt.Rectangle((x0, y0), w, h, edgecolor='green', facecolor=(0,0,0,0), lw=2))
这行代码定义了一个名为 show_box 的函数,它接受两个参数:
- box:一个包含边界框信息的数组或列表,表示为 [x_min, y_min, x_max, y_max]。
- ax:用于绘制边界框的 Matplotlib 的轴对象(axes object)。
从边界框数组中提取了左上角坐标 (x0, y0) 和宽度 w 、高度 h。
使用 Matplotlib 的 Rectangle 函数创建一个矩形补丁,并将其添加到指定的轴对象中。该矩形补丁的位置由左上角坐标 (x0, y0) 和宽度 w 、高度 h 确定。edgecolor=‘green’ 设置矩形的边缘颜色为绿色,facecolor=(0,0,0,0) 设置矩形的填充颜色为透明,lw=2 设置矩形的边缘宽度为2。
综合起来,这个函数的目的是在指定的 Matplotlib 轴对象上绘制边界框,根据给定的边界框信息,绘制一个绿色的矩形框。
3.4 函数4
def show_res(masks, scores, input_point, input_label, input_box, image):
    for i, (mask, score) in enumerate(zip(masks, scores)):
        plt.figure(figsize=(10,10))
        plt.imshow(image)
        show_mask(mask, plt.gca())
        if input_box is not None:
            box = input_box[i]
            show_box(box, plt.gca())
        if (input_point is not None) and (input_label is not None):
            show_points(input_point, input_label, plt.gca())

        print(f"Score: {score:.3f}")
        plt.axis('off')
        plt.show()
这行代码定义了一个名为 show_res 的函数,它接受六个参数:
- masks:一个包含预测的遮罩(mask)的数组列表。
- scores:一个包含预测的分数的数组列表。
- input_point:一个包含输入点坐标的数组。
- input_label:一个包含输入点标签的数组。
- input_box:一个包含输入边界框信息的数组列表。
- image:输入的图像。
使用循环迭代预测的遮罩数组和分数数组。对于每个遮罩和分数,它执行以下操作:
- 创建一个新的 Matplotlib 图形,大小为 10x10。
- 显示输入的图像。
- 调用 show_mask 函数,在当前轴对象上绘制遮罩。
- 如果存在输入边界框 input_box,则获取第 i 个边界框并调用 show_box 函数,在当前轴对象上绘制边界框。
- 如果存在输入点坐标 input_point 和标签 input_label,则调用 show_points 函数,在当前轴对象上绘制点。
- 打印预测的分数。
- 关闭坐标轴。
- 显示绘制的图形。
综合起来,这个函数的目的是在图像上显示预测的遮罩、输入的边界框、输入的点以及预测的分数。
3.5 函数5
def show_res_multi(masks, scores, input_point, input_label, input_box, image):
    plt.figure(figsize=(10, 10))
    plt.imshow(image)
    for mask in masks:
        show_mask(mask, plt.gca(), random_color=True)
    for box in input_box:
        show_box(box, plt.gca())
    for score in scores:
        print(f"Score: {score:.3f}")
    plt.axis('off')
    plt.show()
这行代码定义了一个名为 show_res_multi 的函数,它接受六个参数:
- masks:一个包含多个预测遮罩(mask)的数组列表。
- scores:一个包含多个预测分数的数组。
- input_point:一个包含输入点坐标的数组。
- input_label:一个包含输入点标签的数组。
- input_box:一个包含输入边界框信息的数组列表。
- image:输入的图像。
执行以下操作:
- 创建一个新的 Matplotlib 图形,大小为 10x10。
- 显示输入的图像。
- 使用循环迭代预测的遮罩数组,并调用 show_mask 函数,在当前轴对象上绘制遮罩,使用随机颜色。
- 使用循环迭代输入的边界框数组,并调用 show_box 函数,在当前轴对象上绘制边界框。
- 使用循环迭代预测的分数数组,并打印每个分数。
- 关闭坐标轴。
- 显示绘制的图形。
综合起来,这个函数的目的是在图像上显示多个预测的遮罩、输入的边界框和相应的分数。
四、第四段代码
sam_checkpoint = "pretrained_checkpoint/sam_hq_vit_l.pth"
model_type = "vit_l"
device = "cuda"
sam = sam_model_registry[model_type](checkpoint=sam_checkpoint)
sam.to(device=device)
predictor = SamPredictor(sam)
这段代码主要进行了以下操作:
- 定义了变量 sam_checkpoint,指定了预训练模型的路径
"pretrained_checkpoint/sam_hq_vit_l.pth"。
-
定义了变量 model_type,指定了模型类型 “vit_l”。
-
定义了变量 device,指定了设备类型 “cuda”,即使用 GPU 运行。
-
使用 sam_model_registry 字典根据模型类型从中获取对应的模型类,并传入预训练模型的路径 sam_checkpoint 创建了一个 sam 模型实例。
-
将 sam 模型移动到指定的设备上,即 GPU,使用 to(device=device) 方法。
-
创建了一个 SamPredictor 实例,将 sam 模型作为参数传入,用于进行预测。
综合起来,这段代码加载了预训练的 SAM 模型,将其移动到 GPU 上,并创建了一个SamPredictor 实例,用于使用该模型进行预测。
五、第五段代码
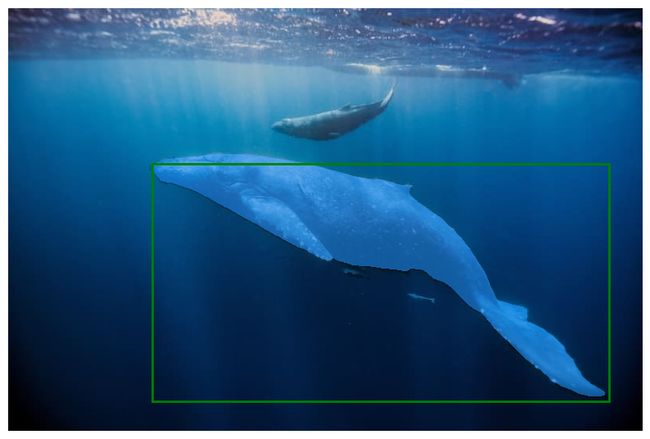
5.1 测试用例1
image = cv2.imread('demo/input_imgs/example0.png')
image = cv2.cvtColor(image, cv2.COLOR_BGR2RGB)
input_box = np.array([[4,13,1007,1023]])
input_point, input_label = None, None
predictor.set_image(image)
masks, scores, logits = predictor.predict(
    point_coords=input_point,
    point_labels=input_label,
    box = input_box,
    multimask_output=False,
    hq_token_only= False,
)
show_res(masks,scores,input_point, input_label, input_box, image)
这段代码执行了以下操作:
- 使用 OpenCV 的 imread 函数从文件中读取图像 ‘demo/input_imgs/example0.png’。
- 使用 OpenCV 的 cvtColor 函数将图像从 BGR 格式转换为 RGB 格式,并将结果赋值给变量 image。
- 定义了变量 input_box,指定了一个边界框的坐标数组 [[4,13,1007,1023]]。
- 定义了变量 input_point 和 input_label,并将它们设置为 None,即没有输入点坐标和标签。
- 使用 predictor.set_image(image) 方法设置预测器的输入图像。
- 调用 predictor.predict 方法进行预测,传入输入点坐标 input_point、输入点标签 input_label、输入边界框 input_box,并设置参数 multimask_output=False 和 hq_token_only=False。
multimask_output=False 表示只输出单个遮罩。
hq_token_only=False 表示不仅输出高质量遮罩。
返回的结果包括预测的遮罩 masks、分数 scores 和逻辑值 logits。
- 调用 show_res 函数,将预测结果显示在图像上,传入预测的遮罩 masks、分数 scores、输入点坐标 input_point、输入点标签 input_label、输入边界框 input_box 和输入图像 image。
综合起来,这段代码加载了输入图像,并使用预测器 predictor 进行了预测,并将预测结果显示在图像上。
5.2 测试用例2
image = cv2.imread('demo/input_imgs/example1.png')
image = cv2.cvtColor(image, cv2.COLOR_BGR2RGB)
input_box = np.array([[306, 132, 925, 893]])
input_point, input_label = None, None
predictor.set_image(image)
masks, scores, logits = predictor.predict(
    point_coords=input_point,
    point_labels=input_label,
    box = input_box,
    multimask_output=False,
    hq_token_only= True,
)
show_res(masks,scores,input_point, input_label, input_box, image)
5.3 测试用例3
image = cv2.imread('demo/input_imgs/example2.png')
image = cv2.cvtColor(image, cv2.COLOR_BGR2RGB)
input_point = np.array([[495,518],[217,140]])
input_label = np.ones(input_point.shape[0])
input_box = None
predictor.set_image(image)
masks, scores, logits = predictor.predict(
    point_coords=input_point,
    point_labels=input_label,
    box = input_box,
    multimask_output=False,
    hq_token_only= True,
)
show_res(masks,scores,input_point, input_label, input_box, image)
5.4 测试用例4
image = cv2.imread('demo/input_imgs/example3.png')
image = cv2.cvtColor(image, cv2.COLOR_BGR2RGB)
input_point = np.array([[221,482],[498,633],[750,379]])
input_label = np.ones(input_point.shape[0])
input_box = None
predictor.set_image(image)
masks, scores, logits = predictor.predict(
    point_coords=input_point,
    point_labels=input_label,
    box = input_box,
    multimask_output=False,
    hq_token_only= False,
)
show_res(masks,scores,input_point, input_label, input_box, image)
5.5 测试用例5
image = cv2.imread('demo/input_imgs/example4.png')
image = cv2.cvtColor(image, cv2.COLOR_BGR2RGB)
input_box = np.array([[64,76,940,919]])
input_point, input_label = None, None
predictor.set_image(image)
masks, scores, logits = predictor.predict(
    point_coords=input_point,
    point_labels=input_label,
    box = input_box,
    multimask_output=False,
    hq_token_only= True,
)
show_res(masks,scores,input_point, input_label, input_box, image)
5.6 测试用例6
image = cv2.imread('demo/input_imgs/example5.png')
image = cv2.cvtColor(image, cv2.COLOR_BGR2RGB)
input_point = np.array([[373,363], [452, 575]])
input_label = np.ones(input_point.shape[0])
input_box = None
predictor.set_image(image)
masks, scores, logits = predictor.predict(
    point_coords=input_point,
    point_labels=input_label,
    box = input_box,
    multimask_output=False,
    hq_token_only= False,
)
show_res(masks,scores,input_point, input_label, input_box, image)
5.7 测试用例7
image = cv2.imread('demo/input_imgs/example6.png')
image = cv2.cvtColor(image, cv2.COLOR_BGR2RGB)
input_box = np.array([[181, 196, 757, 495]])
input_point, input_label = None, None
predictor.set_image(image)
masks, scores, logits = predictor.predict(
    point_coords=input_point,
    point_labels=input_label,
    box = input_box,
    multimask_output=False,
    hq_token_only= False,
)
show_res(masks,scores,input_point, input_label, input_box, image)
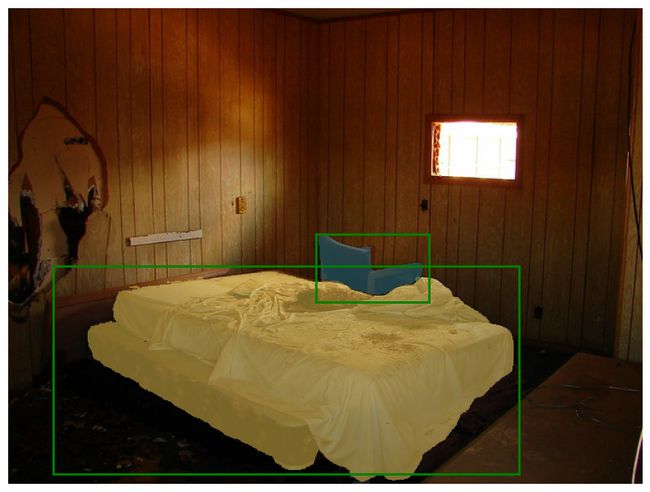
5.8 测试用例8
image = cv2.imread('demo/input_imgs/example7.png')
image = cv2.cvtColor(image, cv2.COLOR_BGR2RGB)
# multi box input
input_box = torch.tensor([[45,260,515,470], [310,228,424,296]],device=predictor.device)
transformed_box = predictor.transform.apply_boxes_torch(input_box, image.shape[:2])
input_point, input_label = None, None
predictor.set_image(image)
masks, scores, logits = predictor.predict_torch(
    point_coords=input_point,
    point_labels=input_label,
    boxes=transformed_box,
    multimask_output=False,
    hq_token_only=False,
)
masks = masks.squeeze(1).cpu().numpy()
scores = scores.squeeze(1).cpu().numpy()
input_box = input_box.cpu().numpy()
show_res_multi(masks, scores, input_point, input_label, input_box, image)


