机器学习_预测概率校准
我们在建模时通常根据准确性或准确性来评估其预测模型,但几乎不会问自己:“我的模型能够预测实际概率吗?”
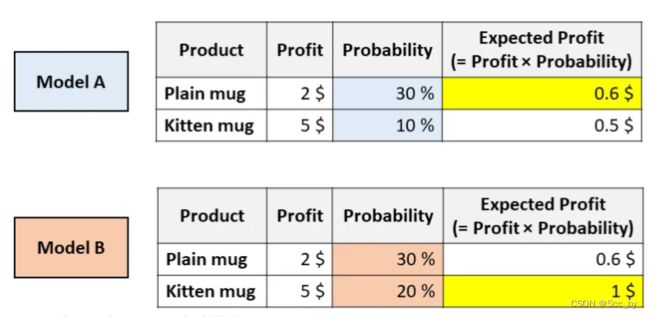
但是,从商业的角度来看,准确的概率估计是非常有价值的(准确的概率估计有时甚至比好的精度更有价值)。来看一个例子。

AB两个模型的AUC一样。但是根据模型A,你可以通过推荐普通马克杯来最大化预期的利润,然而根据模型B,小猫马克杯可以最大化预期的利润。
在像这样的现实应用中,搞清楚哪种模型能够估算出更好的概率是至关重要的事情。 在本文中,我们将了解如何度量概率的校准(包括视觉和数字),以及如何“纠正”现有模型以获得更好的概率。
一、 predict_proba的问题
Python中所有最流行的机器学习库都有一种称为predict_proba的方法:Scikit-learn(例如LogisticRegression,SVC,RandomForest等),XGBoost,LightGBM,CatBoost,Keras等。
但是,“predict_proba”并不能完全预测概率。实际上,不同的研究(尤其是Predicting good probabilities with supervised learning和On Calibration of Modern Neural Networks)表明,最为常见的预测模型并没有进行校准。数值在0与1之间不代表它就是概率!
二、 校准曲线
当预测的概率反映了真实情况的潜在概率时,这些预测概率被称为“已校准”。那么,如何检查一个模型是否已校准?评估一个模型校准的最简单的方法是通过一个称为“校准曲线”的图(也称为“可靠性图”,reliability diagram)。
这个方法主要就是将预测值进行分箱(分箱方法一般用百分比分箱或者均匀分箱),然后基于分箱计算真实值的均值。然后绘制曲线,即将预测概率的平均值与理论平均值进行比较。
Scikit-learn中有简单的方法进行快速分箱并进行均值计算,通过calibration_curve函数:
import numpy as np
import matplotlib.pyplot as plt
import seaborn as sns
from sklearn.calibration import calibration_curve
np.random.seed(2023)

y_true = np.random.randint(0, 2, size=1000)
y_pred = np.random.binomial(n=200, p=0.19, size=1000)
y_pred = (y_pred - y_pred.min())/(y_pred.max()-y_pred.min())
y_means, proba_means = calibration_curve(
    y_true,
    y_pred,
    n_bins=10,
    strategy='quantile'
)

# 分割图片 2:1
fig = plt.figure(constrained_layout=True, figsize=(16, 4))
gs = fig.add_gridspec(1, 3)
axes1, axes2 = fig.add_subplot(gs[:2]), fig.add_subplot(gs[2])
# 绘制分布
sns.histplot(y_pred, alpha=0.7, ax=axes1)
for i in proba_means:
    axes1.axvline(x=i, linestyle='--', color='darkred', alpha=0.7)

axes1.set_title("predict and bin split\nstrategy='quantile'")
axes1.xlabel('Predicted probability')
# 绘制对准曲线
axes2.plot([0, 1], [0, 1], linestyle = '--', label = 'Perfect calibration')
axes2.plot(proba_means, y_means, linestyle='-.')
axes2.set_title('Logistic Calibrator')
axes2.legend()
axes2.xlabel("Bin's mean of predicted probability")
axes2.ylabel("Bin's mean of target variable")
plt.show()
假设你的模型具有良好的精度,则校准曲线将单调增加。但这并不意味着模型已被正确校准。实际上,只有在校准曲线非常接近等分线时(即对角线上的蓝线),您的模型才能得到很好的校准,因为这将意味着预测概率基本上接近理论概率。
最常见的错误校准类型为:

- 系统高估。与真实分布相比,预测概率的分布整体偏右。当您在正数极少的不平衡数据集上训练模型时,这种错误校准很常见。(如红线)
- 系统低估。与真实分布相比,预测概率的分布整体偏左。(如蓝线)
- 分布中心太重。当“支持向量机和提升树之类的算法趋向于将预测概率推离0和1”(引自《Predicting good probabilities with supervised learning》)时,就会发生这类错误校准。(如绿线)
- 分布的尾巴太重。例如,“其他方法(如朴素贝叶斯)具有相反的偏差(bias),并且倾向于将预测概率趋近于0和1”(引自《Predicting good probabilities with supervised learning》)。(如黑线)
三、如何解决校准错误(Python)
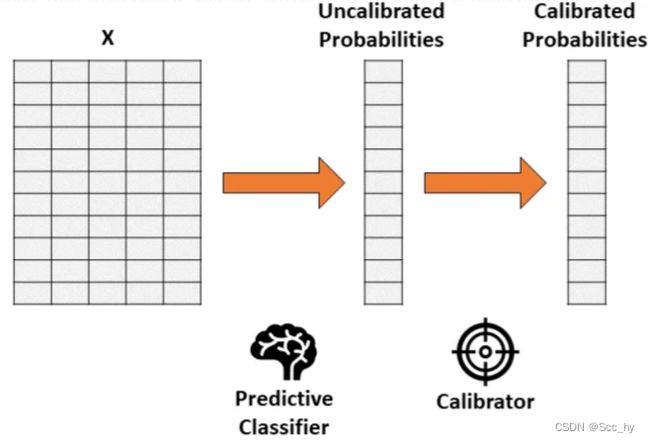
假设你已经训练了一个分类器,该分类器会产生准确但未经校准的概率。概率校准的思想是建立第二个模型(称为校准器),校准器模型能够将你训练的分类器“校准”为实际概率。

需要注意第二个校准模型的训练数据不能和第一个模型的训练数据重合
一般用train_data 训练模型 val_data验证模型 最后test_data测验模型
我们可以拿val_data 进行校准模型训练
两种常被用作校准器的方法:
- 保序回归。一种非参数算法,这种非参数算法将非递减的自由格式行拟合到数据中。行不会减少这一事实是很重要的,因为它遵从原始排序。
- 逻辑回归。
3.1 保序回归校准简单示例
from sklearn.datasets import make_classification
from sklearn.isotonic import IsotonicRegression
from sklearn.linear_model import LogisticRegression
from sklearn.ensemble import RandomForestClassifier

X, y = make_classification(
    n_samples = 15000,
    n_features = 50,
    n_informative = 30,
    n_redundant = 20,
    weights = [.9, .1],
    random_state = 0
)
X_train, X_valid, X_test = X[:5000], X[5000:10000], X[10000:]
y_train, y_valid, y_test = y[:5000], y[5000:10000], y[10000:]

forest = RandomForestClassifier().fit(X_train, y_train)
proba_valid = forest.predict_proba(X_valid)[:, 1]
# 保序回归
iso_reg = IsotonicRegression(y_min = 0, y_max = 1, out_of_bounds = 'clip').fit(proba_valid, y_valid)
test_pred = forest.predict_proba(X_test)[:, 1]
ece_org = expected_calibration_error(y_test, test_pred, bins = 'fd')
quick_calibration_plot(y_test, test_pred, title_msg=f'not  calibration ECE={ece_org:.3f}')

proba_test_forest_isoreg = iso_reg.predict(test_pred)
ece_iosreg = expected_calibration_error(y_test, proba_test_forest_isoreg, bins = 'fd')
quick_calibration_plot(y_test, proba_test_forest_isoreg, title_msg=f'IsotonicRegression ECE={ece_iosreg:.3f}')
3.2 逻辑回归校准简单示例
# logistic
log_reg = LogisticRegression().fit(proba_valid.reshape(-1, 1), y_valid)
proba_test_forest_logreg = log_reg.predict_proba(test_pred.reshape(-1, 1))[:, 1]
ece_logreg = expected_calibration_error(y_test, proba_test_forest_logreg, bins = 'fd')
quick_calibration_plot(y_test, proba_test_forest_logreg, title_msg=f'IsotonicRegression ECE={ece_logreg:.3f}')
logistic校准后,明显预测值更加接近真实概率了,但是没有保序回归效果好。

不过我们不能总是看图分辨校准的怎样,同样需要一个指标来衡量校准情况,就是我们图中的ECE
四、量化校准错误
最常用的方法称为“预期校准误差(Expected Calibration Error)”,这个方法回答了下面的问题:
- 我们模型的预测概率与真实概率平均相距多远?
定义单个类别(bin)的校准误差很容易:即为预测概率的平均值与同一类别(bin)内的正数所占百分比的绝对差值。
如果考虑一下这个定义,它非常直观且符合逻辑。取一个类别(bin),并假设其预测概率的平均值为25%。因此,我们预计该类别中的正数所占百分比大约等于25%。如果这个百分比离25%越远,意味着这个类别(bin)的校准就越差。
因此,预期校准误差Expected Calibration Error, ECE是单个类别的校准误差的加权平均值,其中每个类别的权重与它包含的观测值的数量成正比:
ECE = ∑ b = 1 B ∣ m e a n ( y b ) − m e a n ( p r o b a b ) ∣ ∗ l e n ( y b ) ∑ b = 1 B l e n ( y b ) \textbf{ECE}=\frac{\sum_{b=1}^B|mean(y_b)-mean(proba_b)|*len(y_b)}{\sum_{b=1}^Blen(y_b)} ECE=∑b=1Blen(yb)∑b=1B∣mean(yb)−mean(probab)∣∗len(yb)
python 实现如下
def expected_calibration_error(y, proba, bins = 'fd'):
    bin_count, bin_edges = np.histogram(proba, bins = bins)
    n_bins = len(bin_count)
    bin_edges[0] -= 1e-8 # because left edge is not included
    bin_id = np.digitize(proba, bin_edges, right = True) - 1
    bin_ysum = np.bincount(bin_id, weights = y, minlength = n_bins)
    bin_probasum = np.bincount(bin_id, weights = proba, minlength = n_bins)
    bin_ymean = np.divide(bin_ysum, bin_count, out = np.zeros(n_bins), where = bin_count > 0)
    bin_probamean = np.divide(bin_probasum, bin_count, out = np.zeros(n_bins), where = bin_count > 0)
    ece = np.abs((bin_probamean - bin_ymean) * bin_count).sum() / len(proba)
    return ece
从外面上面的示例绘制的图片中,我们可以看出保序回归其预测概率距离真实概率只有1.4%,Logistic校准后其预测概率距离真实概率只有2.4%。所以保序回归要更好于逻辑回归
参考
参考原文:Python’s «predict_proba» Doesn’t Actually Predict Probabilities (and How to Fix It)


