Matplotlib---柱形图
1. 绘制简单的柱状图
bar函数用于绘制柱状图。下面是bar函数的语法格式:
bar(x, height, width=0.8, bottom=None, align='center', data=None, **kwargs)
参数解释:
x:指定每个柱子的x轴坐标。height:指定每个柱子的高度。width:指定柱子的宽度。默认为0.8。bottom:可选参数,指定柱子的基线位置。默认为None。align:可选参数,指定柱子对齐方式。默认为'center',即柱子居中对齐。data:可选参数,指定数据源。**kwargs:其他可选参数,如颜色、标记等。
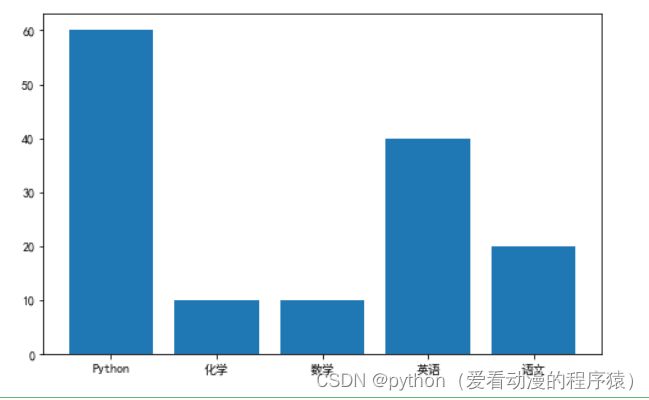
fig = plt.figure(figsize=(8, 5))

x = ['语文', '数学',  '英语', 'Python', '化学']
y = [20, 10, 40, 60, 10]

plt.bar(x, y)
plt.show()
2. Pandas获取Excel数据
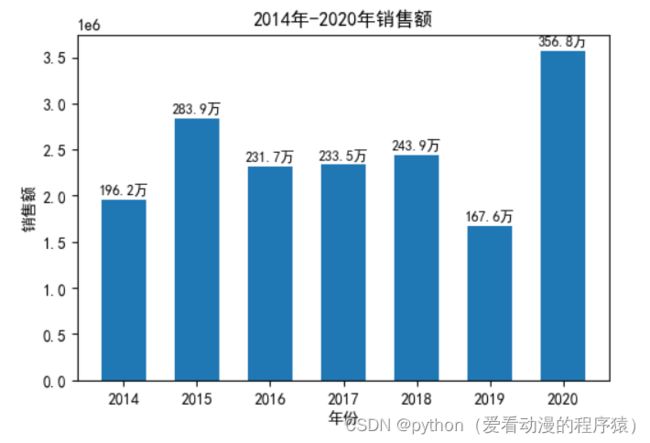
df = pd.read_excel('data/plot.xlsx', sheet_name='bar1')
x, y = df.年份, df.销售额
plt.figure(dpi=100)

plt.title('2014年-2020年销售额')
plt.xlabel('年份')
plt.ylabel('销售额')

# 柱形图
plt.bar(x, y, width=0.6)

# 给每个柱形图加上数字
for a, b in zip(x, y):
    plt.text(x=a, y=b+5e4, s='{:.1f}万'.format(b/10000),
                ha='center', fontsize=9
            )

plt.savefig('images/5-5.png')

plt.show()
3. 一次绘制多个柱状图
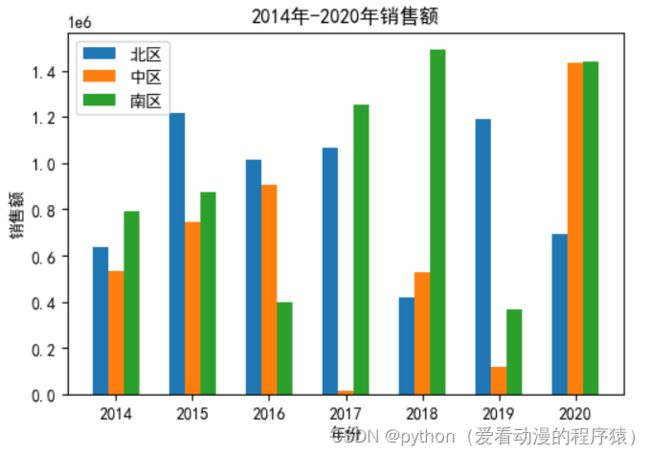
df2 = pd.read_excel('data/plot.xlsx', sheet_name='bar2')
x, y1, y2, y3 = df2.年份,  df2.北区, df2.中区, df2.南区
plt.figure(dpi=100)
plt.title('2014年-2020年销售额')
plt.xlabel('年份')
plt.ylabel('销售额')

width=0.2
plt.bar(x-width, y1, width=width, label='北区')
plt.bar(x, y2, width=width, label='中区')
plt.bar(x+width, y3, width=width, label='南区')

plt.legend()
plt.savefig('images/5-6.png')

plt.show()

# 簇状柱形图
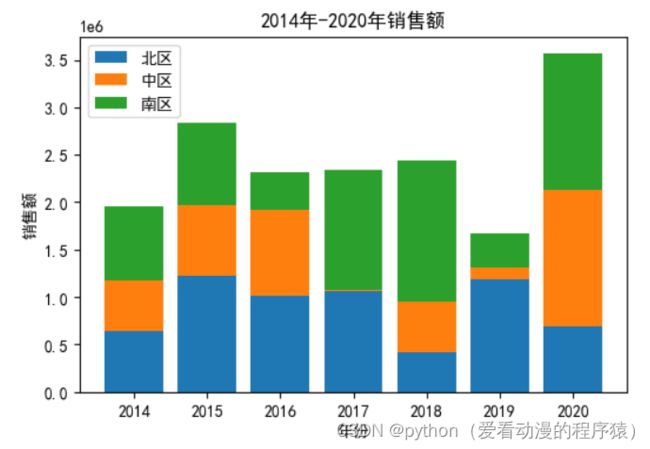
堆叠柱状图:
plt.figure(dpi=100)
plt.title('2014年-2020年销售额')
plt.xlabel('年份')
plt.ylabel('销售额')

plt.bar(x, y1, label='北区')
plt.bar(x, y2, label='中区', bottom=y1)  # 画图的时候y轴的底部起始值
plt.bar(x, y3, label='南区', bottom=y1+y2)

plt.legend()
plt.savefig('images/5-7.png')

plt.show()

# 堆叠柱形图
条形图:
barh函数用于绘制水平柱状图。下面是barh函数的语法格式:
barh(y, width, height=0.8, left=None, align='center', color=None, **kwargs)
参数解释:
y:指定每个柱子的y轴坐标。width:指定每个柱子的宽度。height:可选参数,指定柱子的高度。默认为0.8。left:可选参数,指定柱子的左边界位置。默认为None。align:可选参数,指定柱子对齐方式。默认为'center',即柱子居中对齐。color:可选参数,指定柱子的颜色。**kwargs:其他可选参数,如标记等。
# 条形图

plt.barh(x, y1)
plt.savefig('images/5-8.png')


