一、Numpy
- Numpy(Numerical Python extensions)是一个第三方的Python包,用于科学计算,前身是1995年就开始开发的一个用于数组运算的库
- 极大地简化了向量和矩阵的操作处理,是一些主力软件包(如scikit-learn、scipy、pandas和tensorflow)架构的基础部分。
- Quickstart tutorial:https://docs.scipy.org/doc/numpy/user/quickstart.html
- A Visual Intro to NumPy and Data Representation:http://jalammar.github.io/visual-numpy/
import numpy as np
np.array([2, 3, 6, 7])
array([2, 3, 6, 7])
a=np.array([0,0,0])
a
array([0, 0, 0])
np.array([2, 3, 6, 7.])
array([2., 3., 6., 7.])
np.array([2, 3, 6, 7+1j])
array([2.+0.j, 3.+0.j, 6.+0.j, 7.+1.j])
等差数列的数组
np.arange(5)
array([0, 1, 2, 3, 4])
np.arange(10, 100, 20, dtype=float)
array([10., 30., 50., 70., 90.])
np.linspace(0., 2.5, 5)
array([0. , 0.625, 1.25 , 1.875, 2.5 ])
x = np.linspace(0, 2*np.pi, 10)
print(x)
print(x.shape)
print(x.ndim)
f = np.sin(x)
f
[0.         0.6981317  1.3962634  2.0943951  2.7925268  3.4906585
 4.1887902  4.88692191 5.58505361 6.28318531]
(10,)
1


array([ 0.00000000e+00,  6.42787610e-01,  9.84807753e-01,  8.66025404e-01,
        3.42020143e-01, -3.42020143e-01, -8.66025404e-01, -9.84807753e-01,
       -6.42787610e-01, -2.44929360e-16])
二维数组
a = np.array([[1, 2, 3], [4, 5, 6]])
a
array([[1, 2, 3],
       [4, 5, 6]])
a.shape
(2, 3)
a.ndim
2
a.size
6
改变数组的形状
a = np.arange(0, 20, 1)
a
array([ 0,  1,  2,  3,  4,  5,  6,  7,  8,  9, 10, 11, 12, 13, 14, 15, 16,
       17, 18, 19])
b = a.reshape((4, 5))
b
array([[ 0,  1,  2,  3,  4],
       [ 5,  6,  7,  8,  9],
       [10, 11, 12, 13, 14],
       [15, 16, 17, 18, 19]])
c = a.reshape((20, 1))
c
array([[ 0],
       [ 1],
       [ 2],
       [ 3],
       [ 4],
       [ 5],
       [ 6],
       [ 7],
       [ 8],
       [ 9],
       [10],
       [11],
       [12],
       [13],
       [14],
       [15],
       [16],
       [17],
       [18],
       [19]])
d = a.reshape((-1, 4))
d
array([[ 0,  1,  2,  3],
       [ 4,  5,  6,  7],
       [ 8,  9, 10, 11],
       [12, 13, 14, 15],
       [16, 17, 18, 19]])
print(a)
[ 0 1 2 3 4 5 6 7 8 9 10 11 12 13 14 15 16 17 18 19]
a.shape = (4, 5)
print(a)
[[ 0  1  2  3  4]
 [ 5  6  7  8  9]
 [10 11 12 13 14]
 [15 16 17 18 19]]
形状(N, ), (N, 1)和(1, N)不同
- 形状(N, ):数组是一维的
- 形状(N, 1):数组是二维的,N行一列
- 形状(1, N):数组是二维的,一行N列
a = np.array([1, 2, 3, 4, 5])
b = a.copy()
c1 = np.dot(np.transpose(a), b)
print(c1)
c2 = np.dot(a, np.transpose(b))
print(c2)
ax = np.reshape(a, (5, 1))
print(ax)
bx = np.reshape(b, (1, 5))
print(bx)
c = np.dot(ax, bx)
print(c)
55
55
[[1]
 [2]
 [3]
 [4]
 [5]]
[[1 2 3 4 5]]
[[ 1  2  3  4  5]
 [ 2  4  6  8 10]
 [ 3  6  9 12 15]
 [ 4  8 12 16 20]
 [ 5 10 15 20 25]]
填充数组
np.zeros(3)
array([0., 0., 0.])
np.zeros((2, 2), complex)
array([[0.+0.j, 0.+0.j],
       [0.+0.j, 0.+0.j]])
np.ones((2, 3))
array([[1., 1., 1.],
       [1., 1., 1.]])
np.full((2, 2), 5)
array([[5, 5],
       [5, 5]])
np.random.rand(2, 4)
array([[0.47985176, 0.69532184, 0.26390581, 0.43990791],
       [0.05152074, 0.67448969, 0.31955424, 0.61910693]])
np.random.randn(2, 4)
array([[ 0.16204318,  0.98753155, -0.53755078,  0.93984252],
       [ 0.08822856, -0.47378803, -0.5818457 ,  0.78371192]])
索引与切片
a = np.array([0, 1, 2, 3, 4])
a[1:3]
array([1, 2])
a[:3]
array([0, 1, 2])
a[1:]
array([1, 2, 3, 4])
a[1:-1]
array([1, 2, 3])
a[:]
array([0, 1, 2, 3, 4])
a[::2]
array([0, 2, 4])
a[1:4:2]
array([1, 3])
a[::-1]
array([4, 3, 2, 1, 0])
a = np.arange(12); a.shape = (3, 4); a
array([[ 0,  1,  2,  3],
       [ 4,  5,  6,  7],
       [ 8,  9, 10, 11]])
a[1, 2]
6
a[1, -1]
7
a[:, 1]
array([1, 5, 9])
a[2, :]
array([ 8, 9, 10, 11])
a[1][2]
6
a[2]
array([ 8, 9, 10, 11])
a[0, 1:3]
array([1, 2])
a[1:, 2:]
array([[ 6,  7],
       [10, 11]])
a[::2, 1::2]
array([[ 1,  3],
       [ 9, 11]])
拷贝与视图
a = np.arange(5); a
array([0, 1, 2, 3, 4])
b = a[2:].copy()
b
array([2, 3, 4])
b[0] = 100;
print(b)
print(a)
[100   3   4]
[0 1 2 3 4]
数组运算
x = np.array([[1,2],[3,4]], dtype=np.float64)
y = np.array([[5,6],[7,8]], dtype=np.float64)
print(x + y)
print(np.add(x, y))
[[ 6.  8.]
 [10. 12.]]
[[ 6.  8.]
 [10. 12.]]
print(x - y)
print(np.subtract(x, y))
[[-4. -4.]
 [-4. -4.]]
[[-4. -4.]
 [-4. -4.]]
print(x * y)
print(np.multiply(x, y))
[[ 5. 12.]
 [21. 32.]]
[[ 5. 12.]
 [21. 32.]]
print(x / y)
print(np.divide(x, y))
[[0.2        0.33333333]
 [0.42857143 0.5       ]]
[[0.2        0.33333333]
 [0.42857143 0.5       ]]
print(np.sqrt(x))
[[1.         1.41421356]
 [1.73205081 2.        ]]
广播机制(broadcasting)
https://www.runoob.com/numpy/numpy-broadcast.html
a = np.array([[ 0, 0, 0],
           [10,10,10],
           [20,20,20],
           [30,30,30]])
b = np.array([1,2,3])
print(a + b)
[[ 1  2  3]
 [11 12 13]
 [21 22 23]
 [31 32 33]]
矩阵乘法
A = np.array([[1, 2], [3, 4]])
print(np.dot(A, A))
print(A*A)
[[ 7 10]
 [15 22]]
[[ 1  4]
 [ 9 16]]
x = np.array([10, 20])
np.dot(A, x)
array([ 50, 110])
np.dot(x, A)
array([ 70, 100])
更高效的数学函数
https://docs.scipy.org/doc/numpy/reference/routines.math.html
x = np.array([[1,2],[3,4]])
x
array([[1, 2],
       [3, 4]])
print(np.sum(x))
print(np.sum(x, axis=0))
print(np.sum(x, axis=1))
10
[4 6]
[3 7]
二、Matplotlib
- Matplotlib是Python中最常用的可视化工具之一,可以非常方便地创建海量类型的2D图表和一些基本的3D图表
- 因为在函数的设计上参考了MATLAB,所以叫做Matplotlib
- Pyplot tutorial:https://matplotlib.org/stable/tutorials/introductory/pyplot.html
import matplotlib.pyplot as plt

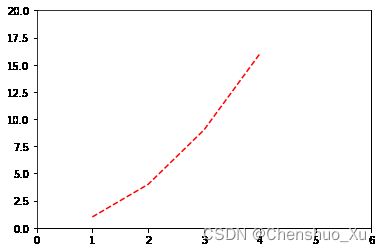
plt.plot([1,2,3,4], [1,4,9,16],  'r--')
plt.axis([0, 6, 0, 20])
plt.show()
%matplotlib inline
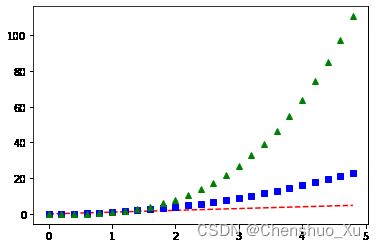
一张图中多条曲线
import numpy as np

t = np.arange(0., 5., 0.2)
plt.plot(t, t, 'r--', t, t**2, 'bs', t, t**3, 'g^')
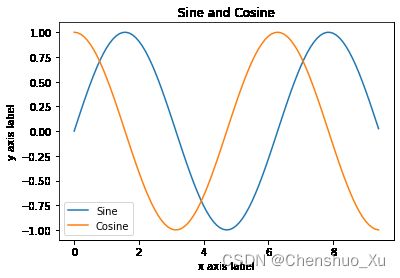
x = np.arange(0, 3*np.pi, 0.1)
y_sin = np.sin(x)
y_cos = np.cos(x)
plt.plot(x, y_sin)
plt.plot(x, y_cos)
plt.xlabel('x axis label')
plt.ylabel('y axis label')
plt.title('Sine and Cosine')
plt.legend(['Sine', 'Cosine'])
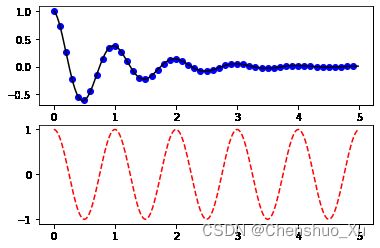
多张子图
def f(t):
    return np.exp(-t) * np.cos(2*np.pi*t)

t1 = np.arange(0.0, 5.0, 0.1)
t2 = np.arange(0.0, 5.0, 0.02)

plt.figure()
plt.subplot(211)
plt.plot(t1, f(t1), 'bo', t2, f(t2), 'k')

plt.subplot(212)
plt.plot(t2, np.cos(2*np.pi*t2), 'r--')
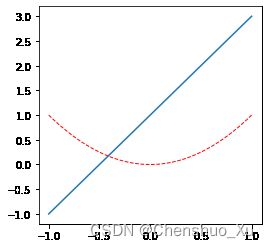
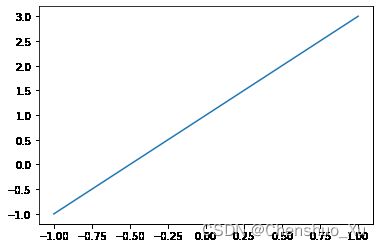
x = np.linspace(-1, 1, 50)
y1 = 2 * x + 1
plt.figure(1)
plt.plot(x, y1)
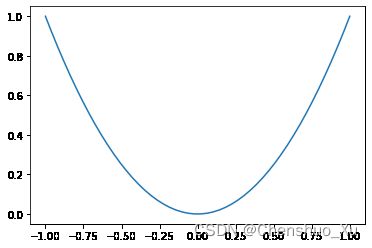
y2 = x**2
plt.figure()
plt.plot(x, y2)
y2 = x**2
plt.figure(num = 5, figsize = (4, 4))
plt.plot(x, y1)
plt.plot(x, y2, color = 'red', linewidth = 1.0, linestyle = '--')
分类变量的图
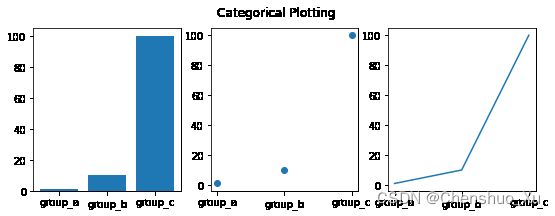
names = ['group_a', 'group_b', 'group_c']
values = [1, 10, 100]

plt.figure(1, figsize=(9, 3))

plt.subplot(131)
plt.bar(names, values)

plt.subplot(132)
plt.scatter(names, values)

plt.subplot(133)
plt.plot(names, values)

plt.suptitle('Categorical Plotting')
Text(0.5, 0.98, 'Categorical Plotting')
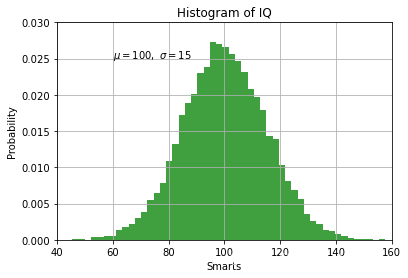
添加文本
mu, sigma = 100, 15
x = mu + sigma * np.random.randn(10000)
n, bins, patches = plt.hist(x, 50, density=1, facecolor='g', alpha=0.75)
plt.xlabel('Smarts')
plt.ylabel('Probability')
plt.title('Histogram of IQ')
plt.text(60, .025, r'$\mu=100,\ \sigma=15$')
plt.axis([40, 160, 0, 0.03])
plt.grid(True)
添加注释
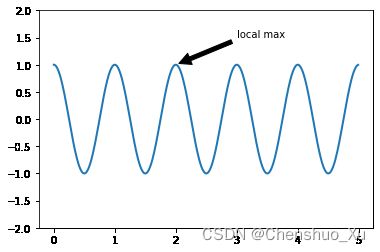
ax = plt.subplot(111)

t = np.arange(0.0, 5.0, 0.01)
s = np.cos(2*np.pi*t)

line, = plt.plot(t, s, lw=2)

plt.annotate('local max', xy=(2, 1), xytext=(3, 1.5), arrowprops=dict(facecolor='black', shrink=0.05))
plt.ylim(-2,2)
(-2.0, 2.0)
三、Pandas
- Pandas是python的一个数据分析包
- 由AQR Capital Management于2008年4月开发,并于2009年底开源出来
- 10 Minutes to pandas:https://pandas.pydata.org/docs/user_guide/10min.html
3.1 Series
- 一维标记数组,由一组数据以及一组与之相关的数据标签(即索引)组成。
传入列表创建Series
import pandas as pd
obj = pd.Series([4, 7, -5, 3])
obj
0    4
1    7
2   -5
3    3
dtype: int64
obj.values
array([ 4, 7, -5, 3], dtype=int64)
obj.index
RangeIndex(start=0, stop=4, step=1)
obj2 = pd.Series([4,7,-5,3], index=['d','b','a','c'])
obj2
d    4
b    7
a   -5
c    3
dtype: int64
obj2.index
Index(['d', 'b', 'a', 'c'], dtype='object')
obj.index = ['Bob', 'Steve', 'Jeff', 'Ryan']
obj
Bob      4
Steve    7
Jeff    -5
Ryan     3
dtype: int64
传入字典创建Series
sdata = {'Ohio': 35000, 'Texas': 71000, 'Oregon': 16000, 'Utah': 5000}
obj3 = pd.Series(sdata)
obj3
Ohio      35000
Texas     71000
Oregon    16000
Utah       5000
dtype: int64
states = ['California', 'Ohio', 'Oregon', 'Texas']
obj4 = pd.Series(sdata, index=states)
obj4
California        NaN
Ohio          35000.0
Oregon        16000.0
Texas         71000.0
dtype: float64
检测缺失数据
pd.isnull(obj4)
California     True
Ohio          False
Oregon        False
Texas         False
dtype: bool
pd.notnull(obj4)
California    False
Ohio           True
Oregon         True
Texas          True
dtype: bool
访问Series中的元素
print(obj2['a'])
obj2['d']= 6
obj2[['c','a','d']]
-5


c    3
a   -5
d    6
dtype: int64
print('b' in obj2)
print('e' in obj2)
print(3 in obj2.values)
True
False
True
对Series的操作
obj2[obj2 > 0]
d    6
b    7
c    3
dtype: int64
obj2*2
d    12
b    14
a   -10
c     6
dtype: int64
np.exp(obj2)
d     403.428793
b    1096.633158
a       0.006738
c      20.085537
dtype: float64
print(obj3)
print(obj4)
obj3 + obj4
Ohio      35000
Texas     71000
Oregon    16000
Utah       5000
dtype: int64
California        NaN
Ohio          35000.0
Oregon        16000.0
Texas         71000.0
dtype: float64


California         NaN
Ohio           70000.0
Oregon         32000.0
Texas         142000.0
Utah               NaN
dtype: float64
obj4.name = 'population'
obj4.index.name = 'state'
obj4
state
California        NaN
Ohio          35000.0
Oregon        16000.0
Texas         71000.0
Name: population, dtype: float64
3.2 DataFrame
- 二维表格型数据结构, 含有一组有序的列,每列都有标签,可看成一个Series的字典,既有行索引又有列索引
创建DataFrame,传入由等长列表或数组构成的字典
data={'state':['Ohio','Ohio','Ohio','Nevada','Nevada'],
      'year':[2000, 2001, 2002, 2001, 2002],
      'pop':[1.5, 1.7, 3.6, 2.4, 2.9]}
frame = pd.DataFrame(data)
frame
|
state |
year |
pop |
| 0 |
Ohio |
2000 |
1.5 |
| 1 |
Ohio |
2001 |
1.7 |
| 2 |
Ohio |
2002 |
3.6 |
| 3 |
Nevada |
2001 |
2.4 |
| 4 |
Nevada |
2002 |
2.9 |
pd.DataFrame(data, columns=['year', 'state', 'pop'])
|
year |
state |
pop |
| 0 |
2000 |
Ohio |
1.5 |
| 1 |
2001 |
Ohio |
1.7 |
| 2 |
2002 |
Ohio |
3.6 |
| 3 |
2001 |
Nevada |
2.4 |
| 4 |
2002 |
Nevada |
2.9 |
frame2 = pd.DataFrame(data, columns=['year', 'state', 'pop', 'debt'], index=['one', 'two', 'three', 'four', 'five'])
frame2
|
year |
state |
pop |
debt |
| one |
2000 |
Ohio |
1.5 |
NaN |
| two |
2001 |
Ohio |
1.7 |
NaN |
| three |
2002 |
Ohio |
3.6 |
NaN |
| four |
2001 |
Nevada |
2.4 |
NaN |
| five |
2002 |
Nevada |
2.9 |
NaN |
创建DataFrame, 传入嵌套字典
pop = {'Nevada': {2001: 2.4, 2002: 2.9}, 'Ohio': {2000: 1.5, 2001: 1.7, 2002:3.6}}
frame3 = pd.DataFrame(pop)
frame3
|
Nevada |
Ohio |
| 2001 |
2.4 |
1.7 |
| 2002 |
2.9 |
3.6 |
| 2000 |
NaN |
1.5 |
frame4 = pd.DataFrame(pop, index=[2001, 2002, 2003])
frame4
|
Nevada |
Ohio |
| 2001 |
2.4 |
1.7 |
| 2002 |
2.9 |
3.6 |
| 2003 |
NaN |
NaN |
缺失数据处理
frame3.dropna(how='all')
|
Nevada |
Ohio |
| 2001 |
2.4 |
1.7 |
| 2002 |
2.9 |
3.6 |
| 2000 |
NaN |
1.5 |
frame4.fillna(value=5)
|
Nevada |
Ohio |
| 2001 |
2.4 |
1.7 |
| 2002 |
2.9 |
3.6 |
| 2003 |
5.0 |
5.0 |
frame3.isnull()
|
Nevada |
Ohio |
| 2001 |
False |
False |
| 2002 |
False |
False |
| 2000 |
True |
False |
访问单列
frame2['state']
one        Ohio
two        Ohio
three      Ohio
four     Nevada
five     Nevada
Name: state, dtype: object
frame2.state
one        Ohio
two        Ohio
three      Ohio
four     Nevada
five     Nevada
Name: state, dtype: object
访问单行
frame2
|
year |
state |
pop |
debt |
| one |
2000 |
Ohio |
1.5 |
NaN |
| two |
2001 |
Ohio |
1.7 |
NaN |
| three |
2002 |
Ohio |
3.6 |
NaN |
| four |
2001 |
Nevada |
2.4 |
NaN |
| five |
2002 |
Nevada |
2.9 |
NaN |
frame2.loc['three']
year     2002
state    Ohio
pop       3.6
debt      NaN
Name: three, dtype: object
frame2.iloc[2]
year     2002
state    Ohio
pop       3.6
debt      NaN
Name: three, dtype: object
修改列
frame2['debt'] = 16.5
frame2
|
year |
state |
pop |
debt |
| one |
2000 |
Ohio |
1.5 |
16.5 |
| two |
2001 |
Ohio |
1.7 |
16.5 |
| three |
2002 |
Ohio |
3.6 |
16.5 |
| four |
2001 |
Nevada |
2.4 |
16.5 |
| five |
2002 |
Nevada |
2.9 |
16.5 |
import numpy as np
frame2['debt'] = np.arange(5)
frame2
|
year |
state |
pop |
debt |
| one |
2000 |
Ohio |
1.5 |
0 |
| two |
2001 |
Ohio |
1.7 |
1 |
| three |
2002 |
Ohio |
3.6 |
2 |
| four |
2001 |
Nevada |
2.4 |
3 |
| five |
2002 |
Nevada |
2.9 |
4 |
val = pd.Series([-1.2, -1.5, -1.7], index=[ 'two', 'four', 'five'])
frame2['debt'] = val
frame2
|
year |
state |
pop |
debt |
| one |
2000 |
Ohio |
1.5 |
NaN |
| two |
2001 |
Ohio |
1.7 |
-1.2 |
| three |
2002 |
Ohio |
3.6 |
NaN |
| four |
2001 |
Nevada |
2.4 |
-1.5 |
| five |
2002 |
Nevada |
2.9 |
-1.7 |
增加列
frame2['eastern'] = (frame2.state == 'Ohio')
frame2
|
year |
state |
pop |
debt |
eastern |
| one |
2000 |
Ohio |
1.5 |
NaN |
True |
| two |
2001 |
Ohio |
1.7 |
-1.2 |
True |
| three |
2002 |
Ohio |
3.6 |
NaN |
True |
| four |
2001 |
Nevada |
2.4 |
-1.5 |
False |
| five |
2002 |
Nevada |
2.9 |
-1.7 |
False |
删除行和列
del frame2['eastern']
frame2
|
year |
state |
pop |
debt |
| one |
2000 |
Ohio |
1.5 |
NaN |
| two |
2001 |
Ohio |
1.7 |
-1.2 |
| three |
2002 |
Ohio |
3.6 |
NaN |
| four |
2001 |
Nevada |
2.4 |
-1.5 |
| five |
2002 |
Nevada |
2.9 |
-1.7 |
frame2.drop(['pop','debt'], axis=1)
|
year |
state |
| one |
2000 |
Ohio |
| two |
2001 |
Ohio |
| three |
2002 |
Ohio |
| four |
2001 |
Nevada |
| five |
2002 |
Nevada |
frame2
|
year |
state |
pop |
debt |
| one |
2000 |
Ohio |
1.5 |
NaN |
| two |
2001 |
Ohio |
1.7 |
-1.2 |
| three |
2002 |
Ohio |
3.6 |
NaN |
| four |
2001 |
Nevada |
2.4 |
-1.5 |
| five |
2002 |
Nevada |
2.9 |
-1.7 |
frame2.drop(columns=['pop','debt'])
|
year |
state |
| one |
2000 |
Ohio |
| two |
2001 |
Ohio |
| three |
2002 |
Ohio |
| four |
2001 |
Nevada |
| five |
2002 |
Nevada |
frame2.drop(['one', 'three', 'five'], axis=0)
|
year |
state |
pop |
debt |
| two |
2001 |
Ohio |
1.7 |
-1.2 |
| four |
2001 |
Nevada |
2.4 |
-1.5 |
frame2
|
year |
state |
pop |
debt |
| one |
2000 |
Ohio |
1.5 |
NaN |
| two |
2001 |
Ohio |
1.7 |
-1.2 |
| three |
2002 |
Ohio |
3.6 |
NaN |
| four |
2001 |
Nevada |
2.4 |
-1.5 |
| five |
2002 |
Nevada |
2.9 |
-1.7 |
frame2.drop(['pop','debt'], axis=1, inplace=True)
frame2
|
year |
state |
| one |
2000 |
Ohio |
| two |
2001 |
Ohio |
| three |
2002 |
Ohio |
| four |
2001 |
Nevada |
| five |
2002 |
Nevada |


