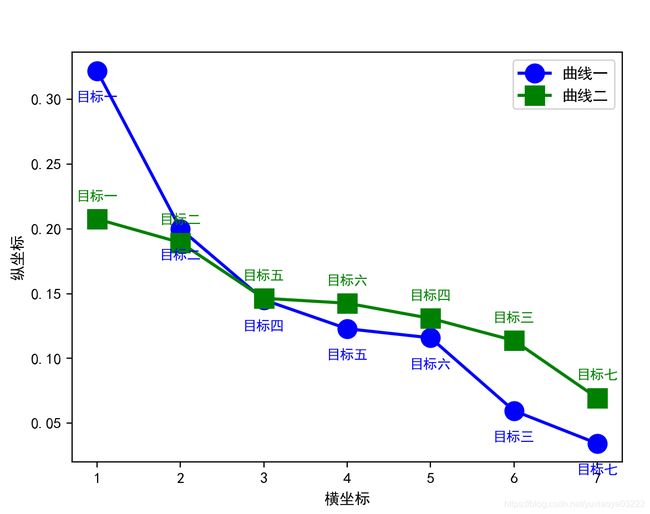
import numpy as np
import matplotlib.pyplot as plt
if __name__ == "__main__":
x1=["目标一","目标二","目标四","目标五","目标六","目标三","目标七"]
x2=["目标一","目标二","目标五","目标六","目标四","目标三","目标七"]
x4=[1,2,3,4,5,6,7]
y1=np.array([0.3220,0.2000,0.1452,0.1229,0.1159,0.0596,0.0343])
y2 = np.array([0.2076,0.1894,0.1464,0.1426,0.1309,0.1138,0.0694])
plt.rcParams['font.sans-serif'] = ['SimHei']
plt.ylabel(u'纵坐标')
plt.xlabel(u'横坐标')
A,=plt.plot(x4, y1, "bo-", linewidth=2, markersize=12, label=u"曲线一")
B,=plt.plot(x4, y2, "gs-", linewidth=2, markersize=12, label=u"曲线二")
font1 = {'family': 'SimHei',
'weight': 'normal',
'size': 10, }
legend = plt.legend(handles=[A, B], prop=font1)
for a in range(0,7):
plt.text(x4[a],y1[a]-0.025, x1[a], ha='center', va='bottom', fontsize=9,color = "b")
plt.text(x4[a], y2[a] +0.013, x2[a], ha='center', va='bottom', fontsize=9, color="g")
plt.show()

