This guide explains how to use remote debugging to inspect or debug code running inFirefox for Android over USB.
This guide's split into two parts: the first part, "Prerequisites" covers stuff you only need to do once, while the second part, "Connecting", covers stuff you need to do each time you connect the device.
Prerequisites
First, you'll need:
- a desktop or laptop computer with Firefox running on it
- an Android device capable of running Firefox for Android with Firefox for Android running on it
- a USB cable to connect the two devices
ADB setup
Next, you'll need to get the desktop and the Android device talking to each other using the adb command-line tool.
On the Android device
- Enable USB debugging (step 2 of this link only).
- Attach the device to the desktop via USB.
On the desktop
- Install the correct version of the Android SDK for your device.
- Using the Android SDK, install the Android Platform Tools.
- Android Platform Tools installs adb in the "platform-tools" directory under the directory in which you installed the Android SDK. Make sure the "platform-tools" directory is in your path.
To check it worked, open up a command shell on the desktop and type:
adb devices
You should see some output like:
List of devices attached
51800F220F01564 device
(The long hex string will be different.)
If you do, then adb has found your device and you've successfully set up ADB.
Enable remote debugging
Next, you need to enable remote debugging on both the Android device and the desktop.
Firefox for Android 24 and earlier
To enable remote debugging on the device, you need to set thedevtools.debugger.remote-enabled preference to true.
Go to about:config in Firefox for Android, type "devtools" into the search box and press the Search key. You'll see all the devtools preferences. Find thedevtools.debugger.remote-enabled preference, and press "Toggle".
Firefox for Android 25 and later
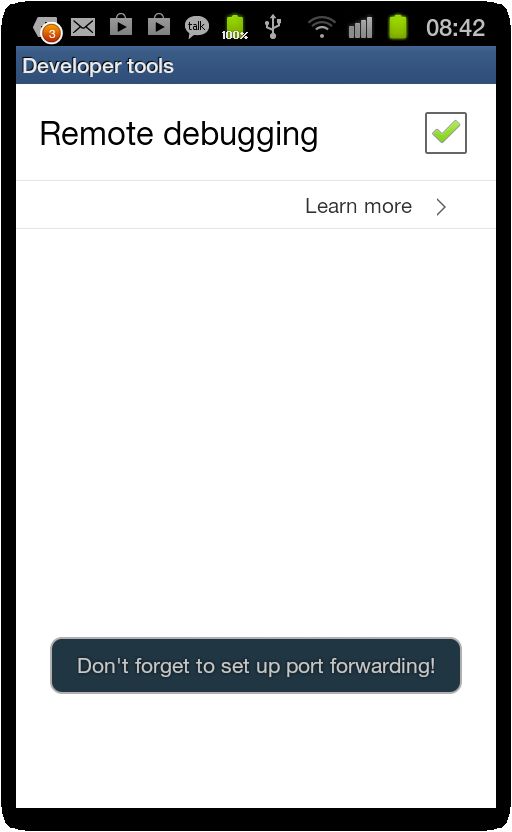
On Firefox for Android 25 and later, there's a menu item to enable remote debugging. Open the menu, select "Settings", then "Developer tools" (on some Android devices you may need to select "More" to see the "Settings" option). Check the "Remote debugging" box:
The browser will display a notification reminding you to set up port forwarding, which we'll do later on.
On the desktop
On the desktop, remote debugging is enabled by a setting in the Toolbox. Open the Toolbox, click the "Settings" button in the toolbar, and check "Enable remote debugging" in the Settings tab:
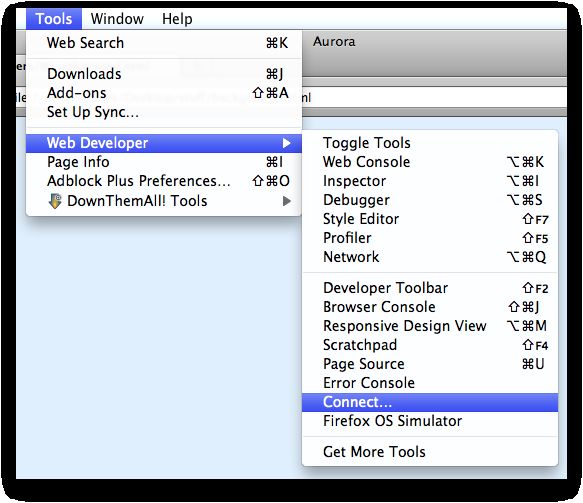
You'll then see a new option in the Web Developer menu labeled "Connect...":
Connecting
Now you can connect the remote debugging tools to the device. First, attach the device to the desktop with a USB cable, if you haven't already.
On the desktop
Go to a command prompt, and type:
adb forward tcp:6000 tcp:6000
(If you've changed the value the Android device uses for a debugging port, you'll need to adjust this accordingly.)
For Firefox OS, type:
adb forward tcp:6000 localfilesystem:/data/local/debugger-socket
You'll need to reissue this command each time you physically attach desktop and device with the USB cable.
Then go to the Web Developer menu on Firefox, and select "Connect...". You'll see a page that looks like this:
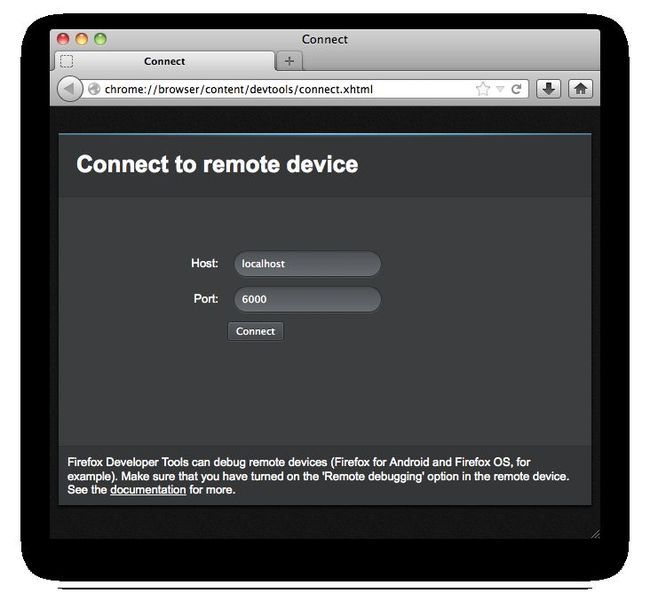 Unless you've changed the port numbers, choose 6000 and press the "Connect" button.
On the Android device
Next you'll see a dialog on the Android device asking you to confirm the connection:
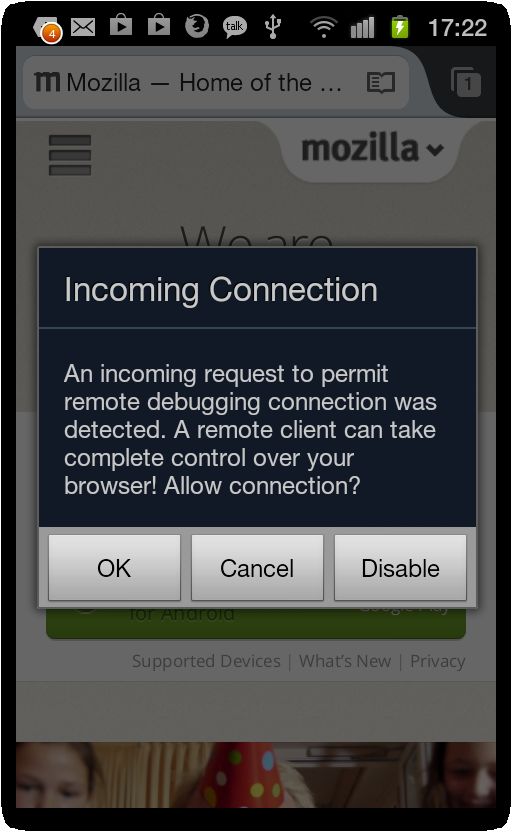 Press "OK". The desktop waits for a few seconds to give you time to acknowledge this dialog: if it times out, just press "Connect" in the desktop dialog again.
On the desktop
Next, the desktop shows you a dialog that looks something like this:
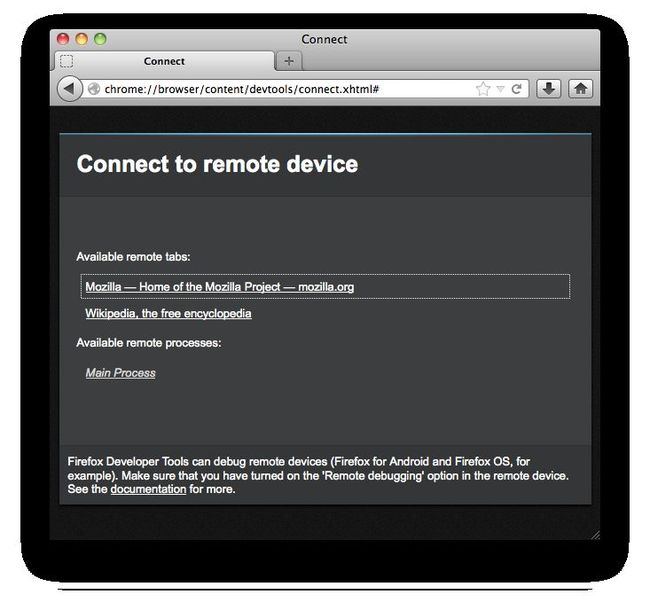 This is asking whether you want to debug web content running in a browser tab, or to debug the browser code itself.
- You'll see one entry under "Available remote tabs" for each open tab, and clicking it will attach the debugging tools to the web content hosted by that tab. If you want to debug your web content, you'll choose the relevant content tab.
- You'll see one entry under "Available remote processes": this is the browser process itself. You'll choose this option if you want to debug the browser's own code.
Let's choose to attach to the mozilla.org website. The Toolbox will open in its own window, attached to the Firefox for Android tab that's currently hosting mozilla.org:
The Toolbox, and the tools it hosts, work in just the same way as they do when attached to local content.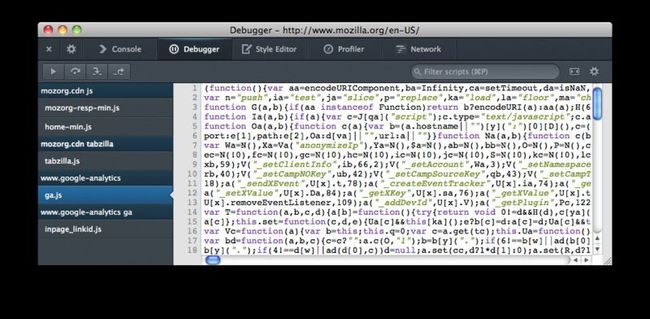
Attachments
| File | Size | Date | Attached by |
|---|---|---|---|
| remote-debugger-about-config-toggle | 95831 bytes | 2013-08-01 15:36:19 | wbamberg |
| remote-debugging-connect-menuitem | 81023 bytes | 2013-08-01 17:15:16 | wbamberg |
| remote-debugging-deskopt-connect | 85186 bytes | 2013-08-01 17:20:07 | wbamberg |
| remote-debugging-device-connect | 167472 bytes | 2013-08-01 17:26:11 | wbamberg |
| remote-debugging-deskopt-select-target | 90358 bytes | 2013-08-01 19:41:30 | wbamberg |
| remote-debugging-console | 124892 bytes | 2013-08-01 20:35:29 | wbamberg |
| remote-debugging-debugger | 266637 bytes | 2013-08-01 20:35:45 | wbamberg |
| remote-debugger-toolbox-settings | 123586 bytes | 2013-08-01 23:09:18 | wbamberg |
| remote-debugging-device-enable | 45182 bytes | 2013-08-02 09:37:26 | wbamberg |
| remote-debugging-overview | 394293 bytes | 2013-08-02 12:25:02 | wbamberg |


