机器学习-支持向量机SVM
文章目录
- 前言
- 1 支持向量机
-
- 1.1 数据集示例1
- 1.2 带有高斯核的SVM
-
- 1.2.1 高斯核
- 1.2.2 数据集示例2
- 1.2.3 数据集示例3
- 2 垃圾邮件分类
-
- 2.1 邮件预处理
- 2.2 训练SVM进行垃圾邮件分类
- 总结
前言
在本练习中,我们将使用支持向量机(SVM)来构建垃圾邮件分类器。
1 支持向量机
我们将从一些简单的2D数据集开始使用SVM来查看它们的工作原理。 然后,我们将对一组原始电子邮件进行一些预处理工作,并使用SVM在处理的电子邮件上构建分类器,以确定它们是否为垃圾邮件。
1.1 数据集示例1
我们要做的第一件事是看一个简单的二维数据集,看看线性SVM如何对数据集进行不同的C值(类似于线性/逻辑回归中的正则化项)。
!tar -zxvf data.tgz
import numpy as np
import pandas as pd
import matplotlib.pyplot as plt
import seaborn as sb
from scipy.io import loadmat

raw_data = loadmat('data/ex5data1.mat')
raw_data
{'__header__': b'MATLAB 5.0 MAT-file, Platform: GLNXA64, Created on: Sun Nov 13 14:28:43 2011',
 '__version__': '1.0',
 '__globals__': [],
 'X': array([[1.9643  , 4.5957  ],
        [2.2753  , 3.8589  ],
        [2.9781  , 4.5651  ],
        [2.932   , 3.5519  ],
        [3.5772  , 2.856   ],
        [4.015   , 3.1937  ],
        [3.3814  , 3.4291  ],
        [3.9113  , 4.1761  ],
        [2.7822  , 4.0431  ],
        [2.5518  , 4.6162  ],
        [3.3698  , 3.9101  ],
        [3.1048  , 3.0709  ],
        [1.9182  , 4.0534  ],
        [2.2638  , 4.3706  ],
        [2.6555  , 3.5008  ],
        [3.1855  , 4.2888  ],
        [3.6579  , 3.8692  ],
        [3.9113  , 3.4291  ],
        [3.6002  , 3.1221  ],
        [3.0357  , 3.3165  ],
        [1.5841  , 3.3575  ],
        [2.0103  , 3.2039  ],
        [1.9527  , 2.7843  ],
        [2.2753  , 2.7127  ],
        [2.3099  , 2.9584  ],
        [2.8283  , 2.6309  ],
        [3.0473  , 2.2931  ],
        [2.4827  , 2.0373  ],
        [2.5057  , 2.3853  ],
        [1.8721  , 2.0577  ],
        [2.0103  , 2.3546  ],
        [1.2269  , 2.3239  ],
        [1.8951  , 2.9174  ],
        [1.561   , 3.0709  ],
        [1.5495  , 2.6923  ],
        [1.6878  , 2.4057  ],
        [1.4919  , 2.0271  ],
        [0.962   , 2.682   ],
        [1.1693  , 2.9276  ],
        [0.8122  , 2.9992  ],
        [0.9735  , 3.3881  ],
        [1.25    , 3.1937  ],
        [1.3191  , 3.5109  ],
        [2.2292  , 2.201   ],
        [2.4482  , 2.6411  ],
        [2.7938  , 1.9656  ],
        [2.091   , 1.6177  ],
        [2.5403  , 2.8867  ],
        [0.9044  , 3.0198  ],
        [0.76615 , 2.5899  ],
        [0.086405, 4.1045  ]]),
 'y': array([[1],
        [1],
        [1],
        [1],
        [1],
        [1],
        [1],
        [1],
        [1],
        [1],
        [1],
        [1],
        [1],
        [1],
        [1],
        [1],
        [1],
        [1],
        [1],
        [1],
        [0],
        [0],
        [0],
        [0],
        [0],
        [0],
        [0],
        [0],
        [0],
        [0],
        [0],
        [0],
        [0],
        [0],
        [0],
        [0],
        [0],
        [0],
        [0],
        [0],
        [0],
        [0],
        [0],
        [0],
        [0],
        [0],
        [0],
        [0],
        [0],
        [0],
        [1]], dtype=uint8)}
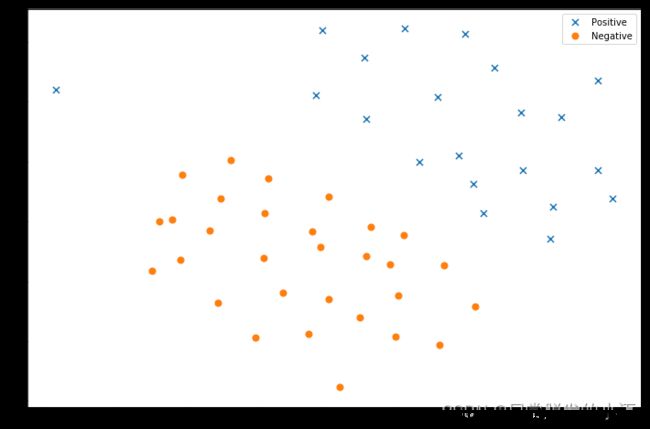
我们将其用散点图表示,其中类标签由符号表示(+表示正类,o表示负类)。
data = pd.DataFrame(raw_data['X'], columns=['X1', 'X2'])
data['y'] = raw_data['y']

positive = data[data['y'].isin([1])]
negative = data[data['y'].isin([0])]

fig, ax = plt.subplots(figsize=(12,8))
ax.scatter(positive['X1'], positive['X2'], s=50, marker='x', label='Positive')
ax.scatter(negative['X1'], negative['X2'], s=50, marker='o', label='Negative')
ax.legend()
plt.show()
from sklearn import svm
svc = svm.LinearSVC(C=1, loss='hinge', max_iter=1000)
svc
LinearSVC(C=1, class_weight=None, dual=True, fit_intercept=True,
          intercept_scaling=1, loss='hinge', max_iter=1000, multi_class='ovr',
          penalty='l2', random_state=None, tol=0.0001, verbose=0)
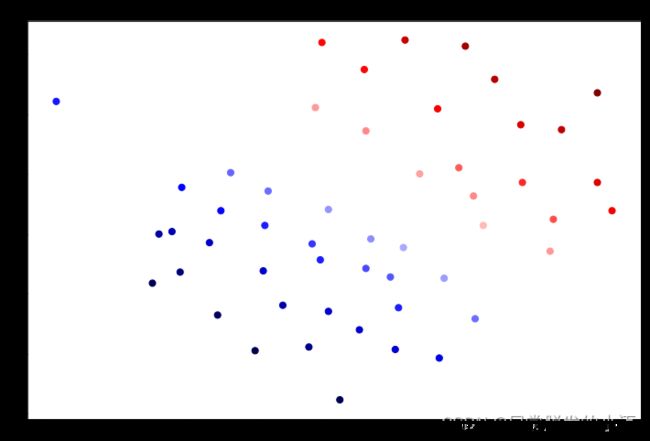
首先,我们使用 C=1 看下结果如何。
svc.fit(data[['X1', 'X2']], data['y'])
svc.score(data[['X1', 'X2']], data['y'])
C:\software\Anaconda3\lib\site-packages\sklearn\svm\_base.py:947: ConvergenceWarning: Liblinear failed to converge, increase the number of iterations.
  "the number of iterations.", ConvergenceWarning)


0.9803921568627451
data['SVM 1 Confidence'] = svc.decision_function(data[['X1', 'X2']])

fig, ax = plt.subplots(figsize=(12,8))
ax.scatter(data['X1'], data['X2'], s=50, c=data['SVM 1 Confidence'], cmap='seismic')
ax.set_title('SVM (C=1) Decision Confidence')
plt.show()
其次,让我们看看如果C的值越大,会发生什么
svc2 = svm.LinearSVC(C=100, loss='hinge', max_iter=1000)
svc2.fit(data[['X1', 'X2']], data['y'])
svc2.score(data[['X1', 'X2']], data['y'])
C:\software\Anaconda3\lib\site-packages\sklearn\svm\_base.py:947: ConvergenceWarning: Liblinear failed to converge, increase the number of iterations.
  "the number of iterations.", ConvergenceWarning)


0.9411764705882353
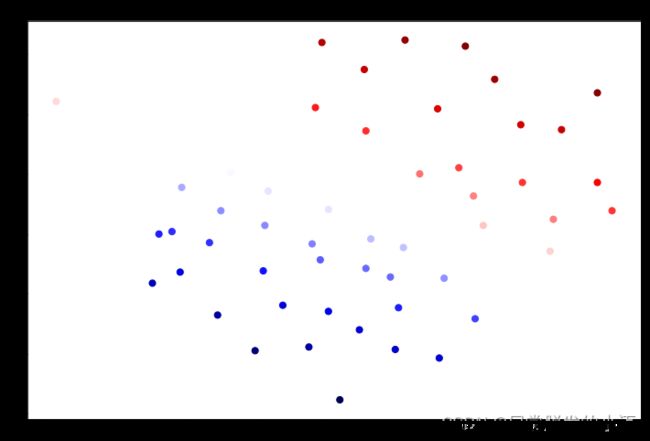
这次我们得到了训练数据的完美分类,但是通过增加C的值,我们创建了一个不再适合数据的决策边界。 我们可以通过查看每个类别预测的置信水平来看出这一点,这是该点与超平面距离的函数。
data['SVM 2 Confidence'] = svc2.decision_function(data[['X1', 'X2']])

fig, ax = plt.subplots(figsize=(12,8))
ax.scatter(data['X1'], data['X2'], s=50, c=data['SVM 2 Confidence'], cmap='seismic')
ax.set_title('SVM (C=100) Decision Confidence')
plt.show()
可以看看靠近边界的点的颜色,区别是有点微妙。 如果您在练习文本中,则会出现绘图,其中决策边界在图上显示为一条线,有助于使差异更清晰。
1.2 带有高斯核的SVM
现在我们将从线性SVM转移到能够使用内核进行非线性分类的SVM。 我们首先负责实现一个高斯核函数。 虽然scikit-learn具有内置的高斯内核,但为了实现更清楚,我们将从头开始实现。
1.2.1 高斯核
你可以将高斯核近似认为具有衡量两个样本之间的“距离”的功能。高斯内核还通过带宽参数 θ \theta θ进行参数化,该参数决定随着示例之间的距离越来越近,相似性度量降低的速度(到0)。
高斯核的公式如下所示:
[外链图片转存失败,源站可能有防盗链机制,建议将图片保存下来直接上传(img-WcY7s8g6-1688135243916)(5-1.png)]
现在,你需要编码代码实现以上公式,用于计算高斯核:
要点:
- 定义gaussian_kernel函数,参数列表为
x1,x2,sigma x1,x2代表两个样本,sigma代表高斯核中的参数值。- 对于给定的测试代码,输出值应为0.324652
###在这里填入代码###
def gaussian_kernel(x1, x2, sigma):
    return np.exp(-(np.sum((x1 - x2) ** 2) / (2 * (sigma ** 2))))
###请运行并测试你的代码###
x1 = np.array([1.0, 2.0, 1.0])
x2 = np.array([0.0, 4.0, -1.0])
sigma = 2

gaussian_kernel(x1, x2, sigma)
0.32465246735834974
1.2.2 数据集示例2
接下来,我们将检查另一个数据集,这次用非线性决策边界。
raw_data = loadmat('data/ex5data2.mat')

data = pd.DataFrame(raw_data['X'], columns=['X1', 'X2'])
data['y'] = raw_data['y']

positive = data[data['y'].isin([1])]
negative = data[data['y'].isin([0])]

fig, ax = plt.subplots(figsize=(12,8))
ax.scatter(positive['X1'], positive['X2'], s=30, marker='x', label='Positive')
ax.scatter(negative['X1'], negative['X2'], s=30, marker='o', label='Negative')
ax.legend()
plt.show()
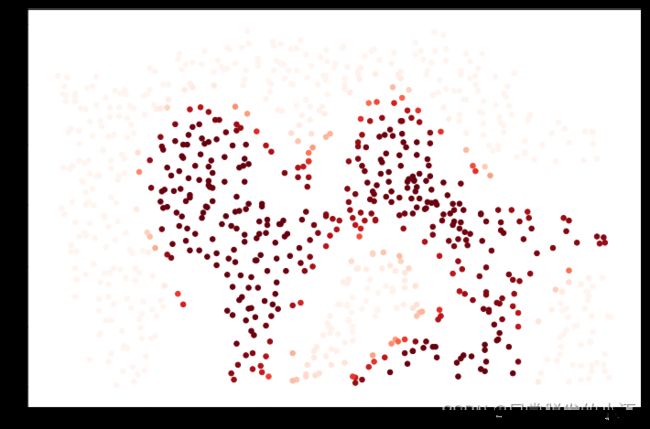
对于该数据集,我们将使用内置的RBF内核构建支持向量机分类器,并检查其对训练数据的准确性。 为了可视化决策边界,这一次我们将根据实例具有负类标签的预测概率来对点做阴影。 从结果可以看出,它们大部分是正确的。
csvc = svm.SVC(C=100, gamma=10, probability=True)
csvc
SVC(C=100, break_ties=False, cache_size=200, class_weight=None, coef0=0.0,
    decision_function_shape='ovr', degree=3, gamma=10, kernel='rbf',
    max_iter=-1, probability=True, random_state=None, shrinking=True, tol=0.001,
    verbose=False)
csvc.fit(data[['X1', 'X2']], data['y'])
csvc.score(data[['X1', 'X2']], data['y'])
0.9698725376593279
data['Probability'] = csvc.predict_proba(data[['X1', 'X2']])[:,0]

fig, ax = plt.subplots(figsize=(12,8))
ax.scatter(data['X1'], data['X2'], s=30, c=data['Probability'], cmap='Reds')
plt.show()
1.2.3 数据集示例3
对于第三个数据集,我们给出了训练和验证集,并且基于验证集性能为SVM模型找到最优超参数。 虽然我们可以使用scikit-learn的内置网格搜索来做到这一点,但是本着遵循练习的目的,我们将从头开始实现一个简单的网格搜索。
你的任务是使用交叉验证集 X v a l , y v a l Xval,yval Xval,yval来确定要使用的最佳参数 C C C和 σ \sigma σ。
你应该编写任何必要的其他代码来帮助您搜索参数 C C C和 σ \sigma σ。对于 C C C和 σ \sigma σ,我们建议以乘法步骤尝试值(例如0.01、0.03、0.1、0.3、1、3、10、30)。请注意,您应尝试 C C C和 σ \sigma σ的所有可能值对(例如, C = 0.3 , σ = 0.1 C = 0.3,\sigma= 0.1 C=0.3,σ=0.1)。 例如,如果您尝试使用上面列出的 C C C和 σ 2 \sigma^2 σ2的8个值中的每一个,最终将训练和评估(在交叉验证集上)总共 8 2 = 64 8^2= 64 82=64个不同模型。
raw_data = loadmat('data/ex5data3.mat')

X = raw_data['X']
Xval = raw_data['Xval']
y = raw_data['y'].ravel()
yval = raw_data['yval'].ravel()

C_values = [0.01, 0.03, 0.1, 0.3, 1, 3, 10, 30, 100]
gamma_values = [0.01, 0.03, 0.1, 0.3, 1, 3, 10, 30, 100]

best_score = 0
best_params = {'C': None, 'gamma': None}

###在这里填入代码###

for C in C_values:
    for gamma in gamma_values:
        svc = svm.SVC(C=C, gamma=gamma)
        svc.fit(X, y)
        score = svc.score(Xval, yval)

        if score > best_score:
            best_score = score
            best_params['C'] = C
            best_params['gamma'] = gamma

best_score, best_params
(0.965, {'C': 0.3, 'gamma': 100})
2 垃圾邮件分类
在这一部分中,我们的目标是使用SVM来构建垃圾邮件过滤器。
2.1 邮件预处理
在练习文本中,有一个任务涉及一些文本预处理,以获得适合SVM处理的格式的数据。 然而,这个任务很简单(将字词映射到为练习提供的字典中的ID),而其余的预处理步骤(如HTML删除,词干,标准化等)已经完成。 我将跳过机器学习任务,而不是重现这些预处理步骤,其中包括从预处理过的训练集构建分类器,以及将垃圾邮件和非垃圾邮件转换为单词出现次数的向量的测试数据集。
你需要将数据从文件data/spamTrain.mat和data/spamTest.mat中加载,并分别构建训练集和测试集。
要点:
- 将你读入的数据输出
- 从数据中提取对应的
X, y, Xtest, ytest - 确保你的数据形状依次为:
(X(4000, 1899), y(4000,), Xtest(1000, 1899), ytest(1000,))
###在这里填入代码###
spam_train = loadmat('data/spamTrain.mat')
spam_test = loadmat('data/spamTest.mat')
print(spam_train)

X = spam_train['X']
Xtest = spam_test['Xtest']
y = spam_train['y'].ravel()
ytest = spam_test['ytest'].ravel()

X.shape, y.shape, Xtest.shape, ytest.shape
{'__header__': b'MATLAB 5.0 MAT-file, Platform: GLNXA64, Created on: Sun Nov 13 14:27:25 2011', '__version__': '1.0', '__globals__': [], 'X': array([[0, 0, 0, ..., 0, 0, 0],
       [0, 0, 0, ..., 0, 0, 0],
       [0, 0, 0, ..., 0, 0, 0],
       ...,
       [0, 0, 0, ..., 0, 0, 0],
       [0, 0, 1, ..., 0, 0, 0],
       [0, 0, 0, ..., 0, 0, 0]], dtype=uint8), 'y': array([[1],
       [1],
       [0],
       ...,
       [1],
       [0],
       [0]], dtype=uint8)}


((4000, 1899), (4000,), (1000, 1899), (1000,))
每个文档已经转换为一个向量,其中1899个维对应于词汇表中的1899个单词。它们的值为二进制,表示文档中是否存在单词。
因此,训练评估是用一个分类器拟合测试数据的问题。
2.2 训练SVM进行垃圾邮件分类
你需要训练svm用于垃圾邮件分类,并分别给出训练集和测试集的准确率。
###在这里填入代码###
svc = svm.SVC()
svc.fit(X, y)
print('Training accuracy = {0}%'.format(np.round(svc.score(X, y) * 100, 2)))
print('Test accuracy = {0}%'.format(np.round(svc.score(Xtest, ytest) * 100, 2)))
Training accuracy = 99.32%
Test accuracy = 98.7%
总结
支持向量机(Support Vector Machine,SVM)是一种强大而广泛应用的机器学习算法,用于分类和回归问题。SVM通过构建最优的超平面来实现分类,最大化类别间的间隔。它能够有效处理高维数据和线性不可分问题,并通过核函数扩展到非线性情况。SVM具有良好的泛化能力和鲁棒性,对于处理复杂数据集和噪声数据具有很好的表现。学习SVM将使你掌握一种强大的工具,为解决各种机器学习问题提供了一种可靠的方法。


