关于使用 D3实现拓扑按地图区域分布的连猜带蒙的一点想法(理解不深,待调整优化)
【预期效果】:将地市归属的节点限制在地图上地市所在范围附近
【初步效果】:(各地市节点之间没有关联)节点基本能待在对应的地市区域

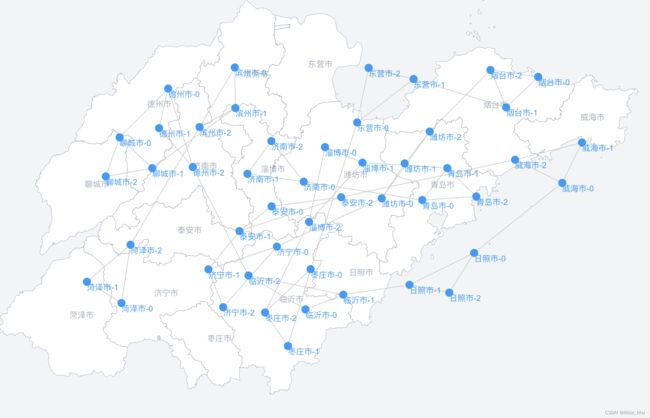
【初步效果】:(各地市节点之间存在关联)因为力的作用节点只能在对应地市区大致的位置方向上
【代码实现(Vue)】
<template>
  <div class="my-wrapper">

    <svg class="my-map">svg>

    <svg class="my-topo" version="1.1" xmlns="http://www.w3.org/2000/svg">
      <g>

        <line
          v-for="(item, index) in lines"
          :key="item.target + index"
          class="my-line"
          stroke="#CCCCCC"
          stroke-width="1"
          :x1="item.source.x"
          :x2="item.target.x"
          :y1="item.source.y"
          :y2="item.target.y"
          :data-source="item.source.id ? item.source.id : item.source"
          :data-target="item.target.id ? item.target.id : item.target" />

        <g
          v-for="item in nodes"
          :key="item.id"
          :data-id="item.id">
          <circle
            class="my-node"
            :cx="item.x"
            :cy="item.y"
            fill="#169BFA"
            r="6" />
          <foreignObject
            class="my-text"
            :x="item.x"
            :y="item.y"
            width="100"
            height="20">
            <div style="font-size: 12px; color: #169BFA;">{{item.id}}div>
          foreignObject>
        g>
      g>
    svg>
  div>
template>
https://geojson.cn/ 这里可以拿到各省份地市的 GeoJson数据
<script>
  import * as d3 from "d3";
  import ShanDongGeoJson from './GeoJson/shandong'

  // 预置拓扑数据
  const cities = ['济南市', '青岛市', '淄博市', '枣庄市', '东营市', '烟台市', '潍坊市', '济宁市', '泰安市', '威海市', '日照市', '临沂市', '德州市', '聊城市', '滨州市', '菏泽市']
  const nodes = [] // 节点数据
  const lines = [] // 连线数据
  cities.forEach((city, index) => {
    Array(...Array(3)).forEach((v, i) => {
      nodes.push({ id: `${city}-${i}`, city })
    })
    // 相同地市节点之间连线
    lines.push(
      { source: `${city}-0`, target: `${city}-1` },
      { source: `${city}-0`, target: `${city}-2` },
      { source: `${city}-1`, target: `${city}-2` },
    )
  })
  // 跨地市节点连线
  lines.push(
    { source: '济南市-0', target: '青岛市-0' },
    { source: '青岛市-1', target: '淄博市-1' },
    { source: '淄博市-2', target: '枣庄市-2' },
    { source: '枣庄市-0', target: '东营市-0' },
    { source: '东营市-1', target: '烟台市-1' },
    { source: '烟台市-2', target: '潍坊市-2' },
    { source: '潍坊市-0', target: '济宁市-0' },
    { source: '济宁市-1', target: '泰安市-1' },
    { source: '泰安市-2', target: '威海市-2' },
    { source: '威海市-0', target: '日照市-0' },
    { source: '日照市-1', target: '临沂市-1' },
    { source: '临沂市-2', target: '德州市-2' },
    { source: '德州市-0', target: '聊城市-0' },
    { source: '聊城市-1', target: '滨州市-1' },
    { source: '滨州市-2', target: '菏泽市-2' },
  )
  // 画布宽高
  const width = 1000, height = 600;

  export default {
    data() {
      return {
        nodes: [],
        lines: [],
      }
    },
    mounted() {
      this.drawMap()
      this.drawTopo()
    },
    methods: {
      drawMap() {
        // 画 map
        const svgMap = d3.select('.my-map')
        const projection = d3.geoMercator().fitExtent(
        [[0, 0],[width, height]], ShanDongGeoJson);
        const pathGenerator = d3.geoPath()
          .projection(projection);
        svgMap.selectAll('path')
          .data(ShanDongGeoJson.features)
          .join('path')
          .attr('d', pathGenerator)
          .attr('stroke-width', 0.5)
          .attr('stroke', 'rgba(69, 90, 116, 0.5)')
          .attr('fill', '#ffffff');
        svgMap.selectAll('text')
          .data(ShanDongGeoJson.features)
          .enter()
          .append('text')
          .attr('x', (d) => projection(d.properties.centroid)[0])
          .attr('y', (d) => projection(d.properties.centroid)[1])
          .attr('transform', `translate(${0},${0})`)
          .text((d) => (d.properties.name))
          .attr('fill', 'rgba(69, 90, 116, 0.5)')
          .attr('font-size', '12px');

        // 计算节点对应地市在画布中的坐标位置
        this.nodes = nodes.map((n, i) => {
          const cityCenter = ShanDongGeoJson.features.find(v => (v.properties.name === n.city))?.properties?.centroid ?? null;
          if (cityCenter && projection) {
            const [cityX, cityY] = projection(cityCenter);
            return { ...n, cityX, cityY };
          } else {
            return { ...n, cityX: null, cityY: null };
          }
        });
        this.lines = lines
      },
      drawTopo() {
        // 画 topo
        d3.forceSimulation(this.nodes)
          .force('link', d3.forceLink(this.lines).id(d => d.id).distance(60)) // 根据需要调整以达到比较美观的效果
          .force('charge', d3.forceManyBody().strength(-50)) // 根据需要调整以达到比较美观的效果
          .force('x', d3.forceX((d) => d.cityX || 0))
          .force('y', d3.forceY((d) => d.cityY || 0))
          .force('collision', d3.forceCollide().radius(30)) // 根据需要调整以达到比较美观的效果
          .force('center', d3.forceCenter(width / 2, height / 2))
          .alphaMin(0.0000001);
      },
    },
  };
</script>