第五章 逻辑回归
第五章 逻辑回归
Logistic回归的⼀般过程
- 收集数据:采⽤任意⽅法收集数据。
- 准备数据:由于需要进⾏距离计算,因此要求数据类型为数值型。另外,结构化数据格式则最佳。
- 分析数据:采⽤任意⽅法对数据进⾏分析。
- 训练算法:⼤部分时间将⽤于训练,训练的⽬的是为了找到最佳的分类回归系数。
- 测试算法:⼀旦训练步骤完成,分类将会很快。
- 使⽤算法
5.1基于逻辑回归和Sigmod函数的分类
逻辑回归:
- 优点:计算代价不⾼,易于理解和实现。
- 缺点:容易⽋拟合,分类精度可能不⾼。
适⽤数据类型:数值型和标称型数据
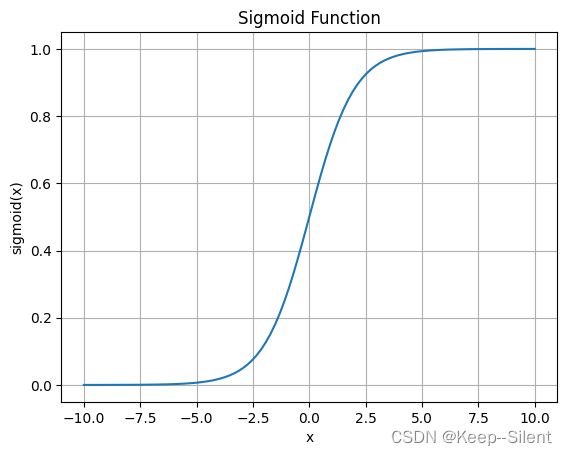
Sigmoid函数: σ ( z ) = 1 1 + e − z \sigma(z)=\frac1{1+\mathrm{e}^{-z}} σ(z)=1+e−z1
import numpy as np
import matplotlib.pyplot as plt

def sigmoid(x):
    return 1 / (1 + np.exp(-x))

# Generate x values from -10 to 10
x = np.linspace(-10, 10, 100)

# Calculate corresponding y values using the sigmoid function
y = sigmoid(x)

# Plot the sigmoid curve
plt.plot(x, y)
plt.xlabel('x')
plt.ylabel('sigmoid(x)')
plt.title('Sigmoid Function')
plt.grid(True)
plt.show()
5.2基于最优化⽅法的最佳回归系数确定
sigmoid的输入记为 z = w 0 x 0 + w 1 x 1 + w 2 x 2 + ⋯ + w n x n z=w_0x_0+w_1x_1+w_2x_2+\cdots+w_nx_n z=w0x0+w1x1+w2x2+⋯+wnxn 即 z = w T x z=w^Tx z=wTx
5.2.1梯度上升法和梯度下降法
梯度 ∇ f ( x , y ) = ( ∂ f ( x , y ) ∂ x ∂ f ( x , y ) ∂ y ) \nabla f(x,y)=\begin{pmatrix}\dfrac{\partial f(x,y)}{\partial x}\\\\\dfrac{\partial f(x,y)}{\partial y}\end{pmatrix} ∇f(x,y)= ∂x∂f(x,y)∂y∂f(x,y)
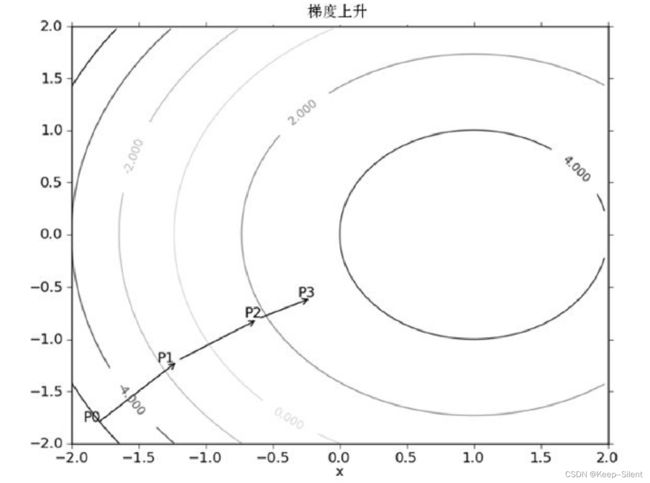
沿梯度上升的方向进行移动,直到移动到满足条件的点
梯度是移动方向,没有移动大小,先定义移动的大小为步长 α \alpha α: w : = w + α ∇ w f ( w ) w:= w+\alpha\nabla_wf(w) w:=w+α∇wf(w)
梯度下降则: w : = w − α ∇ w f ( w ) w:= w-\alpha\nabla_wf(w) w:=w−α∇wf(w)
5.2.2训练算法:使用梯度上升找到最佳参数
伪代码:
- 每个回归系数初始化为1
- 重复R次:
- 计算整个数据集的梯度
- 使⽤
alpha × gradient更新回归系数的向量
- 返回回归系数
def sigmoid(inX):
    return 1.0 / (1 + np.exp(-inX))
def loadDataSet():
    dataMat = []; classLabels = []
    fr = open('05testSet.txt')
    for line in fr.readlines():
        lineArr = line.strip().split()
        dataMat.append(np.array([1.0, float(lineArr[0]), float(lineArr[1])]))
        classLabels.append(int(lineArr[2]))
    return np.array(dataMat), np.array(classLabels)


dataMat, classLabels=loadDataSet()
# print(type(dataMat[:5][0]))
# print((dataMat[:5][0]))
print(dataMat[:5])
print(classLabels[:5])
[[ 1.       -0.017612 14.053064]
 [ 1.       -1.395634  4.662541]
 [ 1.       -0.752157  6.53862 ]
 [ 1.       -1.322371  7.152853]
 [ 1.        0.423363 11.054677]]
[0 1 0 0 0]
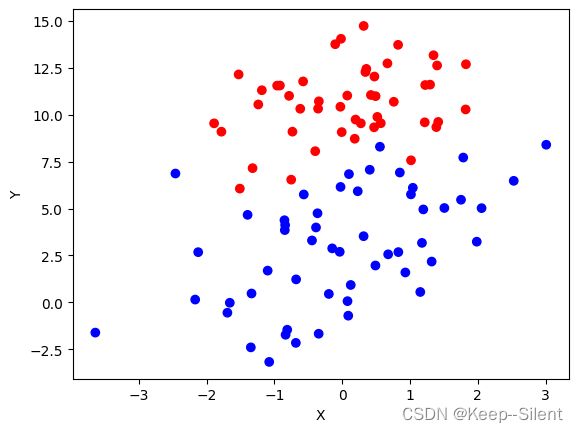
以上为载入数据集,以下进行数据的可视化
import matplotlib.pyplot as plt
import numpy as np
x = [row[1] for row in dataMat]
y = [row[2] for row in dataMat]
plt.scatter(x, y, c=['blue' if row == 1 else 'red' for row in classLabels])
plt.xlabel('X')
plt.ylabel('Y')

plt.show()
def stocGradAscent(dataMatrix, classLabels, numIter=100):
    m, n = np.shape(dataMatrix)
    weights = np.ones(n)   #initialize to all ones
    for j in range(numIter):
        dataIndex = list(range(m))
        for i in range(m):
            alpha = 4/(1.0+j+i)+0.0001    #apha decreases with iteration, does not
            randIndex = int(np.random.uniform(0, len(dataIndex)))#go to 0 because of the constant
            h = sigmoid(sum(dataMatrix[randIndex]*weights))
            error = classLabels[randIndex] - h
            weights = weights + alpha * error * dataMatrix[randIndex]
            del(dataIndex[randIndex])
    return weights
weights=stocGradAscent(dataMat,classLabels)
print(weights)
上诉为梯度下降函数,进行numIter次训练。
alpha为步长,alpha = 4/(1.0+j+i)+0.0001前期ij较大,学习率高,梯度变化大;后期则反之
h经过sigmoid激活后,表示分类
error为真实和预测的差值
权重weights通过alpha、error、点共同更新
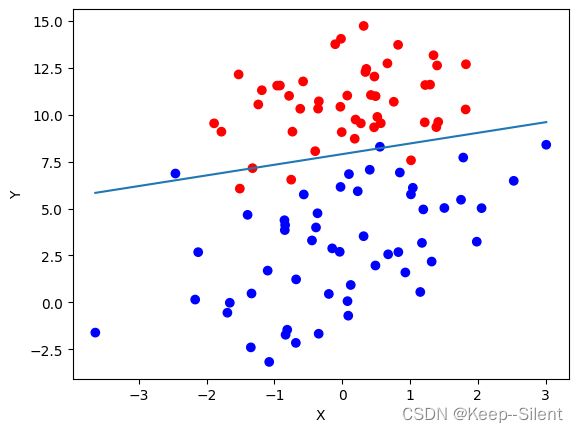
5.2.3分析数据:画出决策边界
在更新梯度中 x = [ 1 , p o i n t x , p o i n t y ] x=[1,\mathrm{point_x},\mathrm{point_y}] x=[1,pointx,pointy], w T x → 0 w^Tx\rightarrow0 wTx→0
令 [ w 0 , w 1 , w 2 ] ∗ [ 1 , p o i n t x , p o i n t y ] = 0 [w_0,w_1,w_2]*[1,\mathrm{point_x},\mathrm{point_y}]=0 [w0,w1,w2]∗[1,pointx,pointy]=0可得 p o i n t y = − w 1 p o i n t x − w 0 w 2 \mathrm{point_y} =\cfrac{-w_1 \mathrm{point_x}-w_0}{w_2} pointy=w2−w1pointx−w0
根据权重weights绘图
x = [row[1] for row in dataMat]
y = [row[2] for row in dataMat]
plt.scatter(x, y, c=['blue' if classLabel == 1 else 'red' for classLabel in classLabels])
plt.xlabel('X')
plt.ylabel('Y')

x = np.linspace(min(x), max(x), 100)
y =(-weights[0]-weights[1]*x)/weights[2]

plt.plot(x, y)

plt.show()
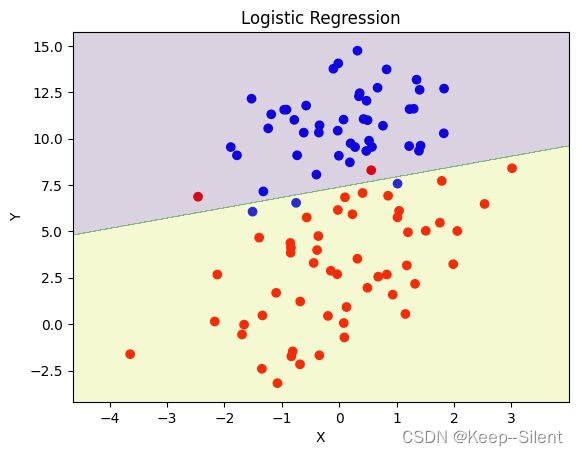
可以看出,绘制的直线基本能够做到正确分类。
5.3调用库进行逻辑回归
import numpy as np
import matplotlib.pyplot as plt
from sklearn.linear_model import LogisticRegression

# 定义数据集
def loadDataSet():
    dataMat = []; classLabels = []
    fr = open('05testSet.txt')
    for line in fr.readlines():
        lineArr = line.strip().split()
        dataMat.append(np.array([ float(lineArr[0]), float(lineArr[1])]))
        classLabels.append(int(lineArr[2]))
    return np.array(dataMat), np.array(classLabels)


dataMat,classLabels = loadDataSet()
colorLables=['red' if label else 'blue' for label in classLabels]
x,y=dataMat[:,0],dataMat[:,1]

# 创建逻辑回归模型
model = LogisticRegression()

# 使用数据拟合模型
model.fit(dataMat, classLabels)


plt.figure()
plt.scatter(x, y, c=colorLables)
x_min, x_max = x.min() - 1, x.max() + 1
y_min, y_max = y.min() - 1, y.max() + 1
xx, yy = np.meshgrid(np.arange(x_min, x_max, 0.02),
                     np.arange(y_min, y_max, 0.02))
Z = model.predict(np.c_[xx.ravel(), yy.ravel()])
print(Z)
Z = Z.reshape(xx.shape)
plt.contourf(xx, yy, Z, alpha=0.2)

plt.title('Logistic Regression')
plt.xlabel('X')
plt.ylabel('Y')
plt.show()
函数关键在于
model = LogisticRegression() #创建回归模型
model.fit(dataMat, classLabels)#训练
可以看出,库函数绘制的直线也能够基本做到正确分类。
