基于python的matplotlib各种绘图操作-01
环境说明:windows10+python3.6.8(X64)+matplotlib(3.0.3)+numpy(1.16.4)
pyecharts==0.5.0
内容说明:博客内容是自己平时所用到的画图知识点的总结。
demo-1:
print(__doc__)

from sklearn.svm import SVC
from sklearn.datasets import load_digits
from sklearn.feature_selection import RFE
import matplotlib.pyplot as plt

# Load the digits dataset
digits = load_digits()
X = digits.images.reshape((len(digits.images), -1))
y = digits.target

# Create the RFE object and rank each pixel
svc = SVC(kernel="linear", C=1)
rfe = RFE(estimator=svc, n_features_to_select=1, step=1)
rfe.fit(X, y)
ranking = rfe.ranking_.reshape(digits.images[0].shape)

# Plot pixel ranking
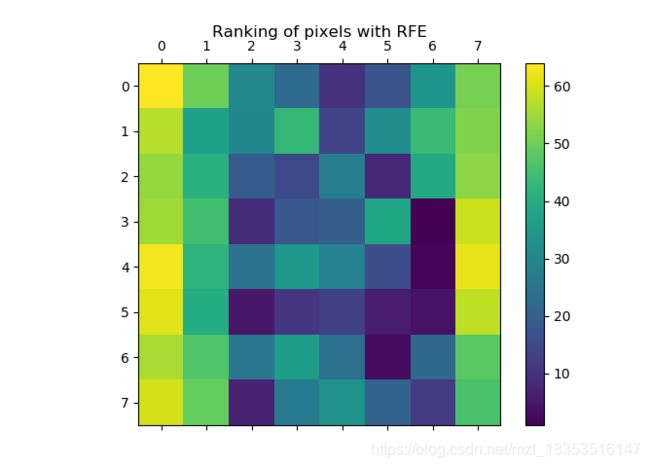
plt.matshow(ranking)
plt.colorbar()
plt.title("Ranking of pixels with RFE")
plt.show()
结果:
demo-2:
'''
1.請利用參考資料
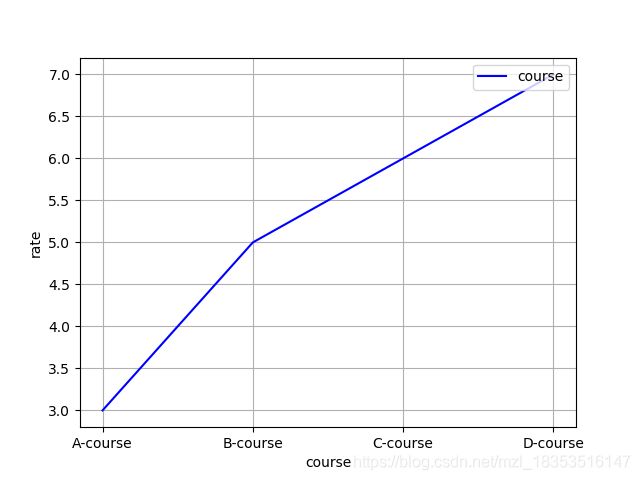
labels=[A-course, B-course, C-course, D-course]
rate = [3,5,6,7]
構建一折線圖,圖形顏色為藍色且須設置X,Y座標軸名稱,圖面網格,圖例
'''
import matplotlib.pyplot as plt
import numpy as np

x = ['A-course', 'B-course', 'C-course', 'D-course']
y = [3, 5, 6, 7]
plt.plot(x, y, color="blue")

plt.xlabel('course')
plt.ylabel('rate')
# 设置图例
plt.legend(["course"], loc="upper right")
plt.grid(True)
plt.show()
结果:
demo-3:
'''
1.請利用參考資料
labels=[A-course, B-course, C-course, D-course]
rate = [3,5,6,7]
構建一折線圖,圖形顏色為藍色且須設置X,Y座標軸名稱,圖面網格,圖例
'''
import matplotlib.pyplot as plt
import numpy as np
x = np.arange(4)#柱状图在横坐标上的位置
bar_width = 0.3
label = ['A-course', 'B-course', 'C-course', 'D-course']
y = [3, 5, 6, 7]
z = [9, 4, 5, 3]
#plt.bar(x, y, color="blue") #垂直柱状图
#plt.barh(x, y) # 水平柱状图
#plt.barh(x+1, y) # 水平柱状图

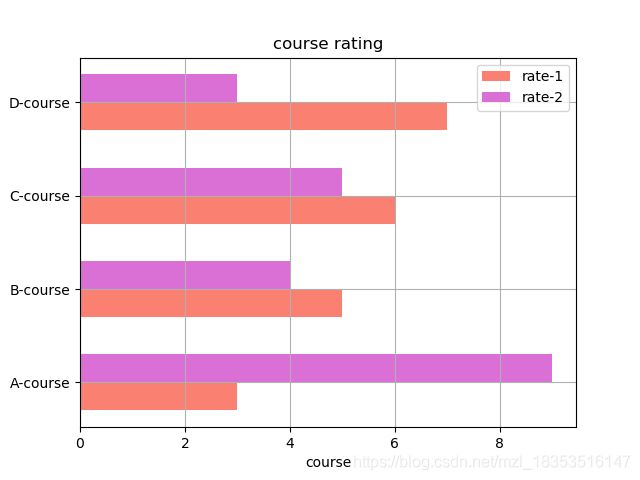
plt.barh(x, y, bar_width, color='salmon')
plt.barh(x+bar_width, z, bar_width, color='orchid')

plt.xlabel('course')
plt.ylabel('rate')
plt.title('course rating')
# 设置图例
plt.legend(["rate-1", "rate-2"], loc="upper right") # 水平柱状图
plt.yticks(x+bar_width/2, label)
plt.grid(True)
plt.show()
demo-4:
from  matplotlib import font_manager as fm
import matplotlib as mpl
import pandas as pd
import numpy as np
import matplotlib.pyplot as plt
plt.style.use('ggplot')#设计显示风格

import matplotlib.pyplot as plt
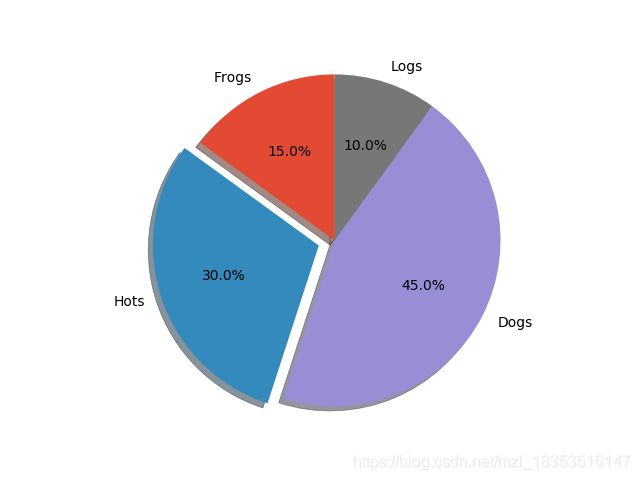
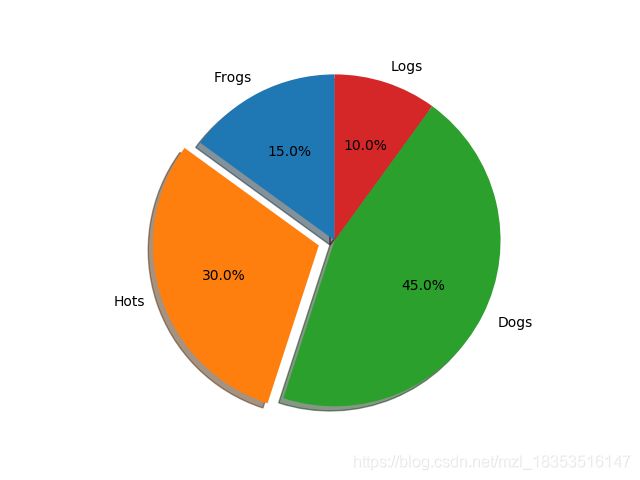
labels='Frogs','Hots','Dogs','Logs'
sizes=[15,30,45,10]
explode=(0,0.1,0,0)
fig1,ax1=plt.subplots()
ax1.pie(sizes,explode=explode,labels=labels,autopct='%1.1f%%',shadow=True,startangle=90)
ax1.axis('equal')
plt.savefig('Demo_offical.jpg')
plt.show()
若不改变风格,结果是这样的:
demo-5:
from  matplotlib import font_manager as fm
import matplotlib as mpl
import pandas as pd
import numpy as np
import matplotlib.pyplot as plt
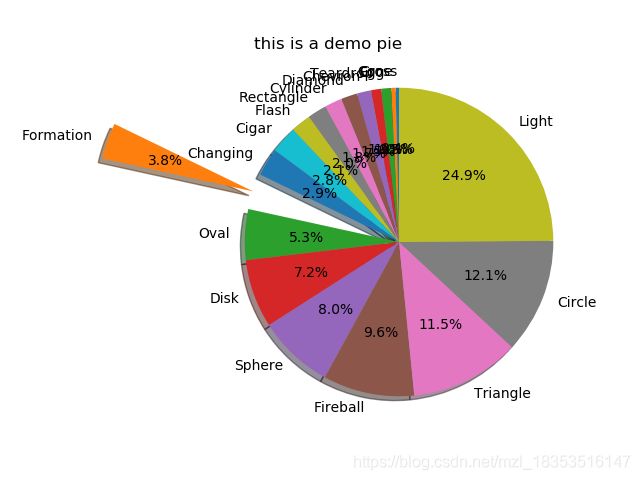
shapes = ['Cross', 'Cone', 'Egg', 'Teardrop', 'Chevron', 'Diamond', 'Cylinder',
'Rectangle', 'Flash', 'Cigar', 'Changing', 'Formation', 'Oval', 'Disk',
'Sphere', 'Fireball', 'Triangle', 'Circle', 'Light']
values = [ 287, 383, 842, 866, 1187, 1405, 1495, 1620, 1717,
2313, 2378, 3070, 4332, 5841, 6482, 7785, 9358, 9818, 20254]
s=pd.Series(values,index=shapes)
print(s)

labels=s.index
sizes=s.values
explode=(0,0,0,0,0,0,0,0,0,0,0,1,0,0,0,0,0,0,0)
fig1,ax1=plt.subplots()
patches,texts,autotexts=ax1.pie(sizes,explode=explode,labels=labels,autopct='%1.1f%%',shadow=True,startangle=90)

ax1.axis('equal')
plt.savefig('demo_project.jpg')
plt.title('this is a demo pie')
plt.show()
demo-6:
import pandas as pd
import numpy as np
import matplotlib.pyplot as plt
import matplotlib.mlab as mlab
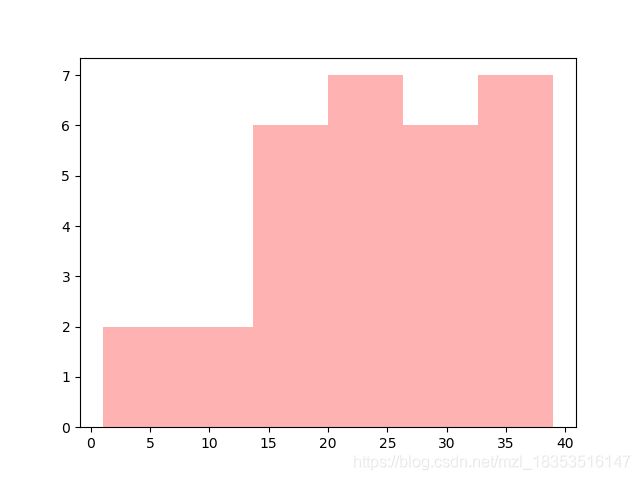
x=[21,22,23,24,25,26,27,28,29,21,3,32,34,35,36,37,38,39,31,33,1,12,13,31,14,15,16,17,18,19]
num_bins=6
n,bins,patches=plt.hist(x,num_bins,facecolor='red',alpha=0.3)
plt.show()
demo-7:
from pyecharts import Bar #导入bar模块

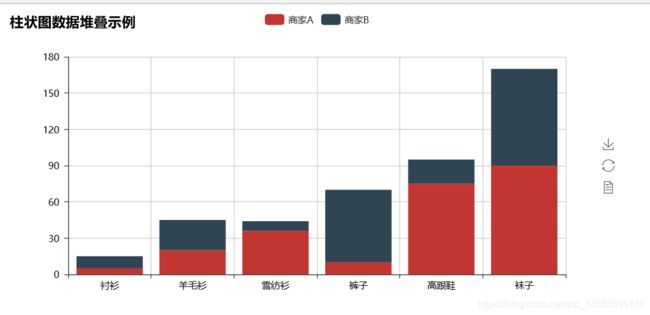
attr = ["衬衫", "羊毛衫", "雪纺衫", "裤子", "高跟鞋", "袜子"] #设置x轴数据
v1 = [5, 20, 36, 10, 75, 90] #第一组数据
v2 = [10, 25, 8, 60, 20, 80] #第二组数据
bar = Bar("柱状图数据堆叠示例") #实例一个柱状图
bar.add("商家A", attr, v1, is_stack=True) #用add函数往图里添加数据并设置堆叠
bar.add("商家B", attr, v2, is_stack=True)
bar.render() #展示数据
结果:会生成一个html文件,下面展示截图。
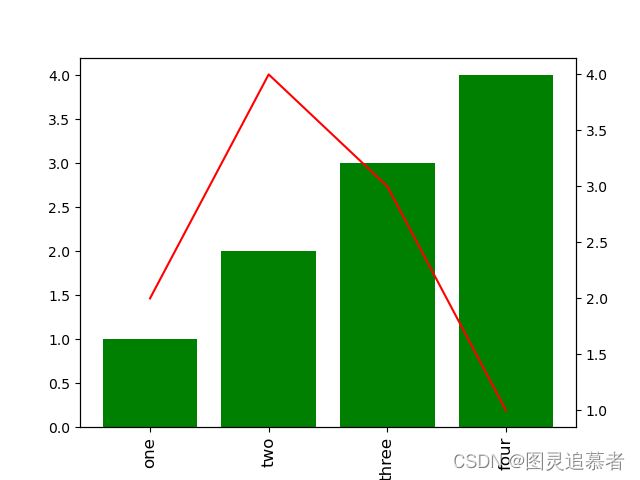
绘制柱状图和折线图结合:
import numpy as np
import matplotlib.pyplot as plt

x = np.array(["one", "two", "three", "four"])
a = np.array([1, 2, 3, 4])
b = np.array([2, 4, 3, 1])

fig, ax1 = plt.subplots()

ax2 = ax1.twinx()
ax1.bar(x, a, color="g")
ax2.plot(x, b, color="r")

# Problem is here.
ax1.set_xticklabels(x, rotation="vertical", size=12)

plt.show()