Python——pyside6中Matplotlib视图动态获取数据并绘制图表+美化
目录
一、前言
二、找到了相关美化文章
三、创建一个绘图线程QThread
四、美化的图表demo
4.1、赛博朋克风格
4.2、其他风格仓库地址
一、前言
- 用pyside6需要一个子线程,来动态的绘制出计算结果
- 而且原来的图表不好看,需要进行美化!!
二、找到了相关美化文章
4个Python库来美化你的Matplotlib图表! - 知乎大家好,我是小F~ Matplotlib是一个被广泛使用的Python数据可视化库,相信很多人都使用过。 但是有时候总会觉得,Matplotlib做出来的图表不是很好看、不美观。 今天小F就给大家分享四个美化Matplotlib图表的Pytho…
https://zhuanlan.zhihu.com/p/624890496
三、创建一个绘图线程QThread
# -*- coding: utf-8 -*-
# @Author : pan
import time

from PySide6.QtCore import QThread, Signal

import matplotlib.pyplot as plt
# mplcyberpunk不可去掉!
import mplcyberpunk
import matplotlib
matplotlib.use('TkAgg')


class WorkerThread(QThread):
    finished = Signal()
    count_signal = Signal()  # 数据信号

    def __init__(self):
        super().__init__()
        self.is_stopped = True
        self.is_continue = True
        self.is_close = True

    # 线程执行
    def run(self):
        self.is_stopped = False
        self.is_continue = False
        self.is_close = False

        # 添加样式 赛博朋克
        plt.style.use("cyberpunk")
        # plt显示中文
        plt.rcParams['font.sans-serif'] = ['SimHei']
        # 隐藏默认的工具栏
        plt.rcParams['toolbar'] = 'None'

        plt.figure("MTSP系统动态图表")


        fig = plt.gcf()
        # 注册窗口关闭事件的回调函数
        fig.canvas.mpl_connect("close_event", self.on_close)

        while True:
            # 终止信号
            if self.is_stopped:
                plt.show()
                return

            # 如果暂停
            if self.is_continue:
                time.sleep(1)
                continue

            # 如果关闭窗口
            if self.is_close:
                return
            # 清除当前坐标轴上的绘图内容,保留其他设置
            plt.cla()
            # 动态数据
            from classes.yolo import y_axis_count_graph as y
            # from classes.yolo import x_axis_time_graph as x
            plt.xlabel('时间')
            plt.ylabel('车流量/辆')
            plt.title('实时流量折线图')
            plt.plot(y, linestyle='-', marker='o')
            # plt.plot(y, ls='-', marker='o', mec='skyblue', mfc='white', color="skyblue")
            # 发光效果+渐变填充
            mplcyberpunk.add_gradient_fill(alpha_gradientglow=0.5, gradient_start='zero')
            plt.xticks([])
            plt.pause(2)


        plt.show()

        try:
            plt.close()
            return
        except:
            plt.close()
            pass
    # 窗口关闭方法
    def on_close(self, event):
        self.is_close = True

    # 停止方法
    def stop(self):
        self.is_stopped = True

    # 暂停方法
    def pause(self):
        self.is_continue = True

    # 继续方法
    def run_continue(self):
        self.is_continue = False
以上方法,仅供参考
⚠️踩坑点:
1、画图之后,要用cla()方法来清空图表内容!(否则会重叠!)
2、线程开启后,关闭窗口,还会让窗口弹窗!(用fig的窗口关闭回调函数解决!)
# 清除当前坐标轴上的绘图内容,保留其他设置
plt.cla()
美化方法:
1、隐藏默认的工具栏
2、设置自己喜欢的样式
3、设置中文字体
4、当x轴数据过多时,隐藏其内容
在主线程中,创建线程即可!
根据主线程的设置,可以控制画图线程的开启、暂停、继续、终止
# 画图线程
self.draw_thread = WorkerThread()

# 线程开启
self.draw_thread.start()

# 折线图继续
self.draw_thread.run_continue()

# 折线图暂停
self.draw_thread.pause()

# 停止画图线程
if self.draw_thread.isRunning():
    print("画图线程退出")
    self.draw_thread.stop()

# 退出画图线程
self.draw_thread.quit()
四、美化的图表demo
4.1、赛博朋克风格
# 安装库
pip install mplcyberpunk
项目地址:https://github.com/dhaitz/mplcyberpunk
import matplotlib.pyplot as plt
import mplcyberpunk

# 添加样式 赛博朋克
plt.style.use("cyberpunk")
# plt显示中文
plt.rcParams['font.sans-serif'] = ['SimHei']
# 隐藏默认的工具栏
plt.rcParams['toolbar'] = 'None'

plt.figure("MTSP系统动态图表")
plt.xlabel('时间')
plt.ylabel('车流量/辆')
plt.title('实时流量折线图')

plt.plot([1, 3, 9, 5, 2, 1, 1], marker='o')
plt.plot([4, 5, 5, 7, 9, 8, 6], marker='o')

mplcyberpunk.add_glow_effects()

plt.show()
4.2、其他风格仓库地址
GitHub - nschloe/matplotx: :bar_chart: More styles and useful extensions for Matplotlib:bar_chart: More styles and useful extensions for Matplotlib - GitHub - nschloe/matplotx: :bar_chart: More styles and useful extensions for Matplotlib
https://github.com/nschloe/matplotx
https://github.com/quantumblacklabs/qbstyleshttps://github.com/quantumblacklabs/qbstyles
科学绘图
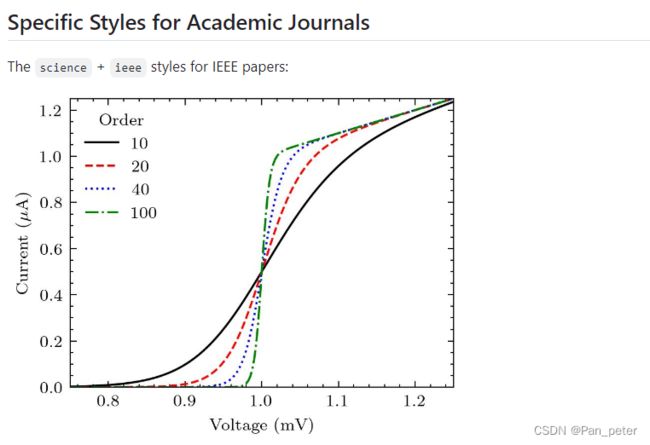
GitHub - garrettj403/SciencePlots: Matplotlib styles for scientific plottingMatplotlib styles for scientific plotting. Contribute to garrettj403/SciencePlots development by creating an account on GitHub.
https://github.com/garrettj403/SciencePlots


