pytorch学习——第二个模型(逻辑回归)
参考该博客系统学习Pytorch笔记二:Pytorch的动态图、自动求导及逻辑回归
c l a s s = { 0 0.5 > y 1 0.5 ≤ y class=\left\{ \begin{array}{rcl} 0 & & {0.5 > y}\\ 1 & & {0.5 \le y}\\ \end{array} \right. class={010.5>y0.5≤y
根据这个y的取值进行分类的,当取值小于0.5, 就判别为类别0, 大于0.5, 就判别为类别1
线性回归: 自变量是 X X X, 因变量是 y y y, 关系: y = w x + b y = w x + b y=wx+b , 图像是一条直线。是分析自变量 x x x和因变量 y y y(标量)之间关系的方法。 注意这里的线性是针对于 w w w说的, 一个 w w w只影响一个 x x x。决策边界是一条直线
逻辑回归:自变量是 X X X, 因变量是 y y y, 只不过这里的 y y y变成了概率。 关系:
y = f ( w x + b ) y=f(wx+b) y=f(wx+b)
f ( x ) = 1 1 + e − x f(x)=\frac{1}{1+e^{-x}} f(x)=1+e−x1
图像也是一条直线。 是分析自变量 x x x与因变量 y y y(概率)之间的关系
数据生成
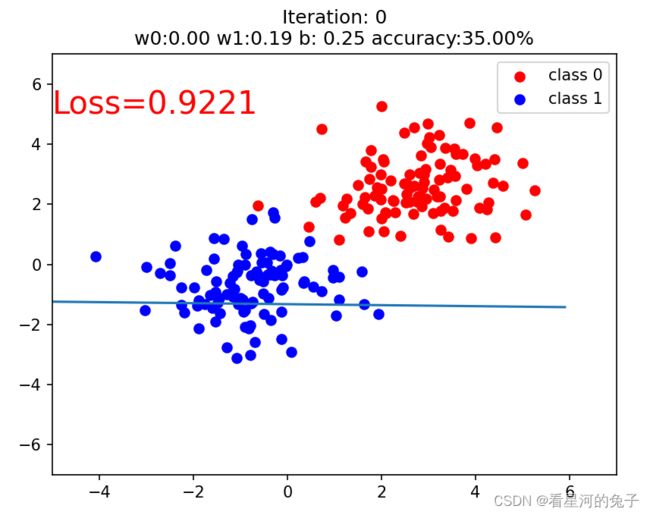
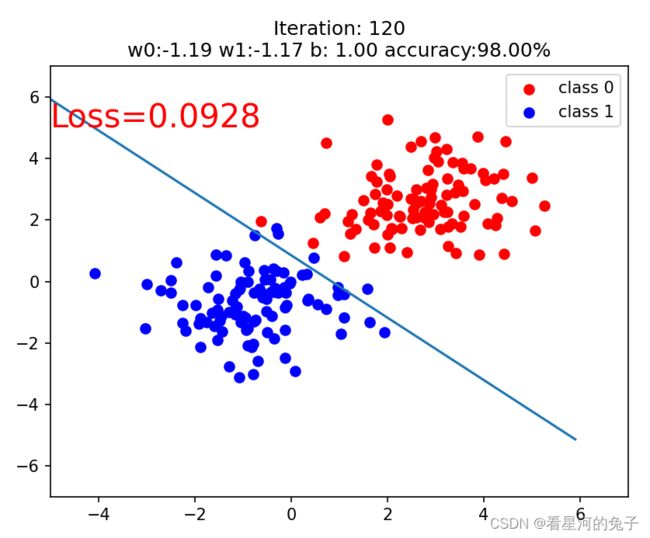
这里我们使用随机生成的方式,生成2类样本(用0和1表示), 每一类样本100个, 每一个样本两个特征。
"""数据生成"""
torch.manual_seed(1)

sample_nums = 100
mean_value = 1.7
bias = 1

n_data = torch.ones(sample_nums, 2)
x0 = torch.normal(mean_value*n_data, 1) + bias  # 类别0  数据shape=(100,2)
y0 = torch.zeros(sample_nums)   # 类别0, 数据shape=(100, 1)
x1 = torch.normal(-mean_value*n_data, 1) + bias   # 类别1, 数据shape=(100,2)
y1 = torch.ones(sample_nums)    # 类别1  shape=(100, 1)

train_x = torch.cat([x0, x1], 0)
train_y = torch.cat([y0, y1], 0)
建立模型
这里我们使用两种方式建立我们的逻辑回归模型,一种是Pytorch的sequential方式,这种方式就是简单,易懂,就类似于搭积木一样,一层一层往上搭。 另一种方式是继承nn.Module这个类搭建模型,这种方式非常灵活,能够搭建各种复杂的网络。
"""建立模型"""
class LR(torch.nn.Module):
    def __init__(self):
        super(LR, self).__init__()
        self.features = torch.nn.Linear(2, 1)  # #in_features代表输入的数据有多少个特征值,out_features同理
        self.sigmoid = torch.nn.Sigmoid()

    def forward(self, x):
        x = self.features(x)
        x = self.sigmoid(x)

        return x

lr_net = LR()     # 实例化逻辑回归模型
另外一种方式,Sequential的方法:
lr_net = torch.nn.Sequential(
    torch.nn.Linear(2, 1),
    torch.nn.Sigmoid()
)
选择损失函数
"""选择损失函数"""
loss_fn = torch.nn.BCELoss()
BCELoss的使用有两点需要注意:
1.仅仅用于二分类问题,全称“BinaryClassEntroyLoss”
2.它需要在使用前进行Sigmoid()
选择优化器
"""选择优化器"""
lr = 0.01
optimizer = torch.optim.SGD(lr_net.parameters(), lr=lr, momentum=0.9)
迭代训练模型
"""模型训练"""
for iteration in range(1000):

    # 前向传播
    y_pred = lr_net(train_x)

    # 计算loss
    loss = loss_fn(y_pred.squeeze(), train_y)

    # 反向传播
    loss.backward()

    # 更新参数
    optimizer.step()

    # 清空梯度
    optimizer.zero_grad()

    # 绘图
    if iteration % 20 == 0:

        mask = y_pred.ge(0.5).float().squeeze()  # 以0.5为阈值进行分类
        correct = (mask == train_y).sum()  # 计算正确预测的样本个数
        acc = correct.item() / train_y.size(0)  # 计算分类准确率

        plt.scatter(x0.data.numpy()[:, 0], x0.data.numpy()[:, 1], c='r', label='class 0')
        plt.scatter(x1.data.numpy()[:, 0], x1.data.numpy()[:, 1], c='b', label='class 1')

        w0, w1 = lr_net.features.weight[0]
        w0, w1 = float(w0.item()), float(w1.item())
        plot_b = float(lr_net.features.bias[0].item())
        plot_x = np.arange(-6, 6, 0.1)
        plot_y = (-w0 * plot_x - plot_b) / w1

        plt.xlim(-5, 7)
        plt.ylim(-7, 7)
        plt.plot(plot_x, plot_y)

        plt.text(-5, 5, 'Loss=%.4f' % loss.data.numpy(), fontdict={'size': 20, 'color': 'red'})
        plt.title("Iteration: {}\nw0:{:.2f} w1:{:.2f} b: {:.2f} accuracy:{:.2%}".format(iteration, w0, w1, plot_b, acc))
        plt.legend()

        plt.show()
        plt.pause(0.5)

        if acc > 0.99:
            break
一些函数解释
.item()
在 pytorch 训练时,一般用到 .item() 方法。比如 loss.item()。
∙ \bullet ∙ 返回这个张量的值作为一个标准的 Python 数字。这只适用于单元素张量。对于其他情况,请参见tolist()。
∙ \bullet ∙ 这个运算是不可微的。
在浮点数结果上使用 .item() 函数可以提高显示精度,所以我们在求 loss 或者 accuracy 时,一般使用 x[1,1].item() 而不是单纯使用 x[1,1]。
.ge()
![]()
上面式子a代表y_pred中>0.5的全部为true
b代表浮点转换
mask代表合成序列
全部代码
import torch
import matplotlib.pyplot as plt
import numpy as np
"""数据生成"""
torch.manual_seed(1)

sample_nums = 100
mean_value = 1.7
bias = 1

n_data = torch.ones(sample_nums, 2)
x0 = torch.normal(mean_value*n_data, 1) + bias  # 类别0  数据shape=(100,2)
y0 = torch.zeros(sample_nums)   # 类别0, 数据shape=(100, 1)
x1 = torch.normal(-mean_value*n_data, 1) + bias   # 类别1, 数据shape=(100,2)
y1 = torch.ones(sample_nums)    # 类别1  shape=(100, 1)

train_x = torch.cat([x0, x1], 0)
train_y = torch.cat([y0, y1], 0)
"""建立模型"""


class LR(torch.nn.Module):
    def __init__(self):
        super(LR, self).__init__()
        self.features = torch.nn.Linear(2, 1)  # Linear 是module的子类,是参数化module的一种,与其名称一样,表示着一种线性变换。输入2个节点,输出1个节点
        self.sigmoid = torch.nn.Sigmoid()

    def forward(self, x):
        x = self.features(x)
        x = self.sigmoid(x)

        return x


lr_net = LR()  # 实例化逻辑回归模型
"""选择损失函数"""
loss_fn = torch.nn.BCELoss()
"""选择优化器"""
lr = 0.01
optimizer = torch.optim.SGD(lr_net.parameters(), lr=lr, momentum=0.9)
#acce=[]
"""模型训练"""
for iteration in range(1000):

    # 前向传播
    y_pred = lr_net(train_x)

    # 计算loss
    loss = loss_fn(y_pred.squeeze(), train_y)

    # 反向传播
    loss.backward()

    # 更新参数
    optimizer.step()

    # 清空梯度
    optimizer.zero_grad()

    # 绘图
    if iteration % 20 == 0:
        mask = y_pred.ge(0.5).float().squeeze()  # 以0.5为阈值进行分类
        correct = (mask == train_y).sum()  # 计算正确预测的样本个数
        acc = correct.item() / train_y.size(0)  # 计算分类准确率

        plt.scatter(x0.data.numpy()[:, 0], x0.data.numpy()[:, 1], c='r', label='class 0')
        plt.scatter(x1.data.numpy()[:, 0], x1.data.numpy()[:, 1], c='b', label='class 1')

        w0, w1 = lr_net.features.weight[0]
        w0, w1 = float(w0.item()), float(w1.item())
        plot_b = float(lr_net.features.bias[0].item())
        plot_x = np.arange(-6, 6, 0.1)
        plot_y = (-w0 * plot_x - plot_b) / w1

        plt.xlim(-5, 7)
        plt.ylim(-7, 7)
        plt.plot(plot_x, plot_y)

        plt.text(-5, 5, 'Loss=%.4f' % loss.data.numpy(), fontdict={'size': 20, 'color': 'red'})
        plt.title("Iteration: {}\nw0:{:.2f} w1:{:.2f} b: {:.2f} accuracy:{:.2%}".format(iteration, w0, w1, plot_b, acc))
        plt.legend()

        plt.show()
        plt.pause(0.5)

        if acc > 0.99:
            break
	# x=range(0,100,20)
	# plt.plot(x, acce, c='r')
	# plt.title('acc')
	# plt.ylabel("acc")
	# plt.xlabel("epoch")
	# plt.show()


