python解决直线过网格问题_numpy_matplotlib
python解决直线过网格问题_numpy_matplotlib
文章目录
- python解决直线过网格问题_numpy_matplotlib
-
- 1. 问题引子
- 2. 改良和更新
- 3. 验证与实例
1. 问题引子
这个问题是来源于小白五年前写的一篇博客,当时是小白还在逛matlab论坛的时候发现被反复提问的一个问题。
在一个10*10的网格里,判断一条线段经过的网格位置(判断序号)。并计算经过的每个网格内线段的长度。
当时是用matlab写了一段粗劣的程序,并发表在本人的博客上:Matlab研究小问题:如何计算一条线段所经过的网格区域和各区域内的长度
令人没有想到的是,这篇博客的热度一直不减,几乎每年的四五月份就会受到大量的关注、收藏和提问。
小白估计这是某专业某门课程里的编程作业。
小白想起当年在学校里,折腾Matlab的那些日子,不免也心有感伤。青葱岁月一去不复返了。
这里也想对还在用Matlab的同学们提个醒:Matlab上手容易,配置简单,作为算法学习的初步工具尚可,但其一,它是商业软件,其二,目前就业市场上的岗位,绝少是以Matlab编程为要求的。(这也都是小白当年吃过的亏)
所以小白近几年也几乎不再去写matlab相关的博文了。
因为完全可以用python来做科学计算的替代。(至少小白够用了,至于Matlab的那些高阶功能,一般也用不上)
2. 改良和更新
在以下实现的python版本中,使用了numpy和matplotlib库来作为计算和绘图的辅助。
对于五年前的那个问题,以下版本
- 添加了网格横纵数的自由设置,不再只能是10*10;
- 将斜截式方程改良为两点式方程;
- 可以计算直线段垂直或平行于网格的情况。
Talk is cheap, show me the code.
二话不说,直接上干货:
# -*- coding:utf-8 -*-
import numpy as np
import matplotlib.pyplot as plt

def calLineCrossPt(pt11, pt12, pt21, pt22):
    [x1, y1] = pt11
    [x2, y2] = pt12
    [x3, y3] = pt21
    [x4, y4] = pt22
    x0 = -10
    y0 = -10

    if abs((x3-x4)*(y1-y2)-(x1-x2)*(y3-y4)) > np.spacing(20):
        x0 = ((x3-x4)*(x2*y1-x1*y2)-(x1-x2)*(x4*y3-x3*y4))/ \
            ((x3-x4)*(y1-y2)-(x1-x2)*(y3-y4))
        y0 = ((y3-y4)*(y2*x1-y1*x2)-(y1-y2)*(y4*x3-y3*x4))/ \
            ((y3-y4)*(x1-x2)-(y1-y2)*(x3-x4))
    elif abs(y1-y2)<np.spacing(20):
        x0 = x1
        y0 = y1
    elif abs(x1-x2)<np.spacing(20):
        x0 = x1
        y0 = y1

    pt0 = [x0, y0]
    return pt0


def calDistance2pts(pt1, pt2):
    return np.sqrt((pt1[0]-pt2[0])**2 + (pt1[1]-pt2[1])**2)


def calTwoPointDist(pt1, pt2, x_grid_num, y_grid_num):
    [x1, y1] = pt1
    [x2, y2] = pt2
    xmin = min(x1, x2)
    xmax = max(x1, x2)
    ymin = min(y1, y2)
    ymax = max(y1, y2)

    xcal = range(int(np.ceil(xmin)), int(np.floor(xmax)) + 1)
    ycal = range(int(np.ceil(ymin)), int(np.floor(ymax)) + 1)
    pt0 = [[x1, y1], [x2, y2]]

    for xi in xcal:
        pt00 = calLineCrossPt(pt1, pt2, [xi, ymin], [xi, ymax])
        pt0.append([xi, pt00[1]])
    for yi in ycal:
        pt01 = calLineCrossPt(pt1, pt2, [xmin, yi], [xmax, yi])
        pt0.append([pt01[0], yi])
    pt0 = np.unique(pt0, axis=0)
    print('=======================')
    print('直线与格网的交点(包含直线首尾端点)')
    print(pt0)

    ptInd = []
    gridInd = []
    dist = []
    pos = np.array(range(1, x_grid_num * y_grid_num + 1))
    pos = pos.reshape((y_grid_num, x_grid_num))
    for i in range(0, len(pt0)-1):
        tmpDist = np.sqrt((pt0[i][0] - pt0[i + 1][0]) ** 2 + (pt0[i][1] - pt0[i + 1][1]) ** 2)
        if tmpDist < np.spacing(20):
            continue
        dist.append(tmpDist)
        xind = np.max([int(np.ceil(pt0[i][0])), int(np.ceil(pt0[i + 1][0]))]) - 1
        yind = np.max([int(np.ceil(pt0[i][1])), int(np.ceil(pt0[i + 1][1]))]) - 1
        ptInd.append([xind, yind])
        gridInd.append(pos[yind][xind])

    return [gridInd, dist]


if __name__ == '__main__':
    point1 = [3.2, 2]
    point2 = [7.5, 8.2]
    x_grid_num = 8
    y_grid_num = 12

    [gridInd, gridDist] = calTwoPointDist(point1, point2, x_grid_num, y_grid_num)
    print('======================')
    print('直线穿过以下编号的格子:')
    print(gridInd)
    print('直线在格子中的分段距离为:')
    print(gridDist)

    x = np.linspace(0, x_grid_num, x_grid_num + 1)
    y = np.linspace(0, y_grid_num, y_grid_num + 1)
    [grid_x, grid_y] = np.meshgrid(x, y)

    fig = plt.figure()
    ax = plt.axes()

    for xi in x:
        lx = plt.axvline(xi)
        plt.setp(lx, color='b', linewidth=1.0, alpha=1)

    for yi in y:
        ly = plt.axhline(yi)
        plt.setp(ly, color='b', linewidth=1.0, alpha=1)

    ax.set_xlim([0, x_grid_num])
    ax.set_ylim([0, y_grid_num])
    ax.set_aspect(1)

    plt.xticks(range(0,x_grid_num + 1))
    plt.yticks(range(0,y_grid_num + 1))

    pos = np.array(range(1, x_grid_num * y_grid_num + 1))
    pos = pos.reshape((y_grid_num, x_grid_num))
    for yi in range(0, y_grid_num):
        for xi in range(0, x_grid_num):
            plt.text(xi+0.3-(len(str(pos[yi][xi]))-2)*0.1, yi+0.3, pos[yi][xi])

    plt.plot([point1[0], point2[0]], [point1[1], point2[1]], linewidth =1, color='r')
    plt.show()
3. 验证与实例
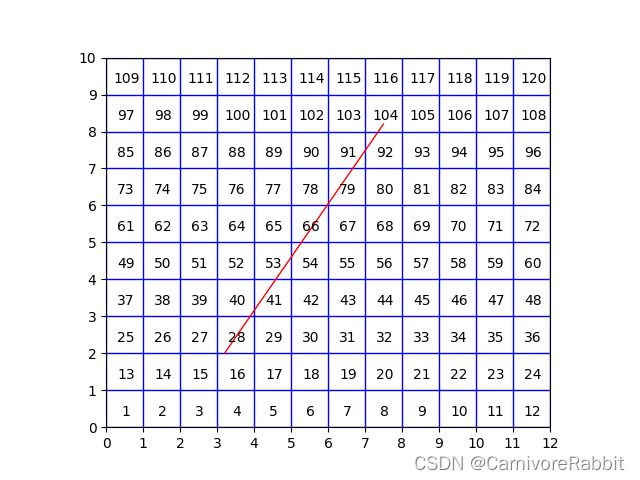
Example1: 当网格为12*10,设置直线段两个点为[3.2, 2] [7.5, 8.2]时
=======================
直线与格网的交点(包含直线首尾端点)
[[3.2        2.        ]
 [3.2        2.        ]
 [3.89354839 3.        ]
 [4.         3.15348837]
 [4.58709677 4.        ]
 [5.         4.59534884]
 [5.28064516 5.        ]
 [5.97419355 6.        ]
 [6.         6.0372093 ]
 [6.66774194 7.        ]
 [7.         7.47906977]
 [7.36129032 8.        ]
 [7.5        8.2       ]]
======================
直线穿过以下编号的格子:
[28, 40, 41, 53, 54, 66, 78, 79, 91, 92, 104]
直线在格子中的分段距离为:
[1.216967281912105, 0.18679032699116002, 1.030176954920945, 0.7245200562081378, 0.49244722570396715, 1.2169672819121056, 0.045282503513008256, 1.1716847783990967, 0.5830122327299841, 0.6339550491821208, 0.2433934563824204]
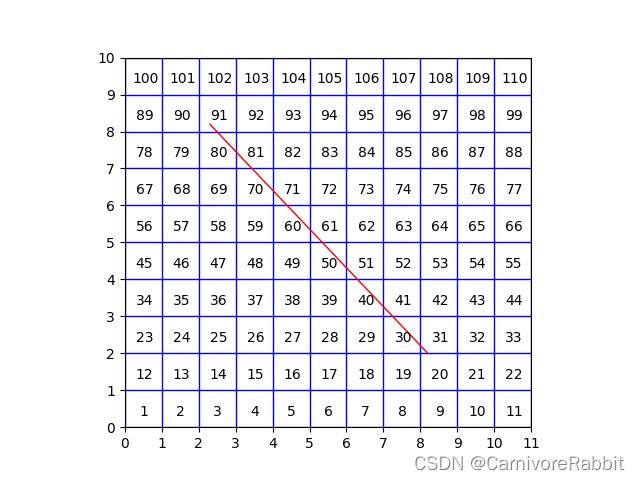
Example2: 当网格为11*10,设置直线段两个点为[2.3, 8.2] [8.2, 2]时
=======================
直线与格网的交点(包含直线首尾端点)
[[2.3        8.2       ]
 [2.49032258 8.        ]
 [3.         7.46440678]
 [3.44193548 7.        ]
 [4.         6.41355932]
 [4.39354839 6.        ]
 [5.         5.36271186]
 [5.34516129 5.        ]
 [6.         4.31186441]
 [6.29677419 4.        ]
 [7.         3.26101695]
 [7.2483871  3.        ]
 [8.         2.21016949]
 [8.2        2.        ]]
======================
直线穿过以下编号的格子:
[91, 80, 81, 70, 71, 60, 61, 50, 51, 40, 41, 30, 31]
直线在格子中的分段距离为:
[0.276084560784252, 0.7393450949815596, 0.641077708939706, 0.8095360850114535, 0.5708867189098116, 0.8797270750413492, 0.5006957288799165, 0.9499180650712435, 0.4305047388500215, 1.0201090551011383, 0.3603137488201268, 1.0903000451310336, 0.290122758790232]
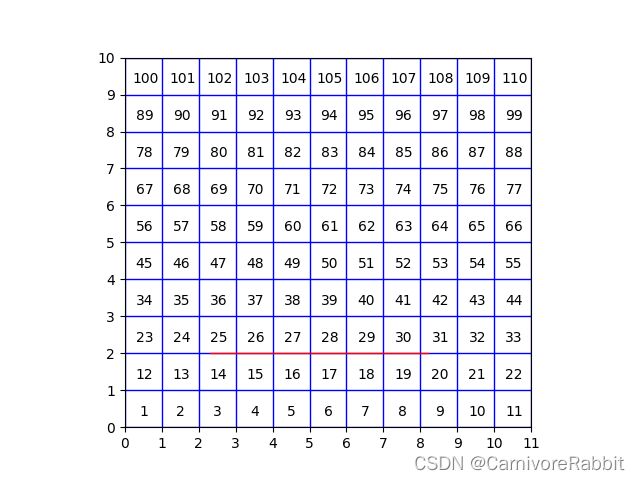
Example3: 当网格为11*10,设置直线段两个点为[2.3, 2] [8.2, 2]时

=======================
直线与格网的交点(包含直线首尾端点)
[[2.3 2. ]
 [3.  2. ]
 [4.  2. ]
 [5.  2. ]
 [6.  2. ]
 [7.  2. ]
 [8.  2. ]
 [8.2 2. ]]
======================
直线穿过以下编号的格子:
[14, 15, 16, 17, 18, 19, 20]
直线在格子中的分段距离为:
[0.7000000000000002, 1.0, 1.0, 1.0, 1.0, 1.0, 0.1999999999999993]
这个例子中我们发现,如果是刚好在网格分界线上,这个程序给出的网格是更靠下及更靠左的那个格子位置。
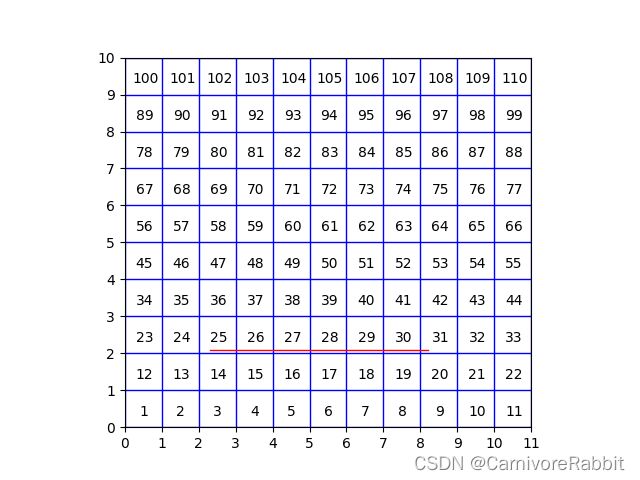
Example4: 当网格为11*10,设置直线段两个点为[2.3, 2.1] [8.2, 2.1]时

=======================
直线与格网的交点(包含直线首尾端点)
[[2.3 2.1]
 [3.  2.1]
 [4.  2.1]
 [5.  2.1]
 [6.  2.1]
 [7.  2.1]
 [8.  2.1]
 [8.2 2.1]]
======================
直线穿过以下编号的格子:
[25, 26, 27, 28, 29, 30, 31]
直线在格子中的分段距离为:
[0.7000000000000002, 1.0, 1.0, 1.0, 1.0, 1.0, 0.1999999999999993]
Example5: 当网格为11*10,设置直线段两个点为[8.2, 2.5] [8.2, 8.5]时

=======================
直线与格网的交点(包含直线首尾端点)
[[8.2 2.5]
 [8.2 3. ]
 [8.2 4. ]
 [8.2 5. ]
 [8.2 6. ]
 [8.2 7. ]
 [8.2 8. ]
 [8.2 8.5]]
======================
直线穿过以下编号的格子:
[31, 42, 53, 64, 75, 86, 97]
直线在格子中的分段距离为:
[0.5, 1.0, 1.0, 1.0, 1.0, 1.0, 0.5]


