机器学习实战12-基于历史数据的台风的预测与分析(2023年第5号台风杜苏丙将登陆台湾和福建)
大家好,我是微学AI,今天给大家介绍一下机器学习实战12-基于历史数据的台风的预测与分析,台风预测与分析是一项重要的气象研究项目,旨在提前预测、跟踪和分析台风的路径、强度和可能对地区造成的影响。台风是一种强大而具有破坏性的气象灾害,经常给沿海地区带来巨大的风暴潮、暴雨和强风,并导致洪涝、山体滑坡等次生灾害。
2023年7月21日上午8时,今年第5号台风“杜苏芮”在菲律宾以东洋面生成。当天下午5时,其中心位于菲律宾马尼拉偏东方向约1270公里的洋面上,中心附近最大风力8级(18米/秒,热带风暴级),未来或加强为15级强台风。
本文将通过历史数据研究1951-2022年期间在亚洲地区生成的所有台风进行分析预测,研究台风路径。

台风形成的原因
台风是由一系列复杂的气象和海洋因素共同作用而形成的。以下是台风形成的主要原因:
温暖的海水温度:台风需要温暖的海水作为能量源。通常,海水温度超过26.5摄氏度才有利于台风的发展。热带和亚热带地区的海洋通常具有足够的温暖水域来支持台风的形成。
湿润的大气条件:台风形成需要湿润的大气条件,即较高的水汽含量。当海水蒸发进入大气中时,形成对流云团。这些云团会随着更多水汽凝结而逐渐增长,并最终形成台风。
强水平风切变的缺乏:水平风切变指的是不同高度水平风速的变化。如果水平风切变较小,台风会更容易形成。较小的风切变能够帮助保持台风的整体结构和旋转。
初始扰动:台风的形成通常需要一个初始扰动或扰动波作为起始。这个扰动可以是热带气旋、气象前线交汇或其他天气系统的相互作用。它们能够提供初始的旋转和上升气流,从而促进台风的发展。
应季的环流条件:台风的形成通常在夏季和初秋最为活跃,因为这时候热带和亚热带地区的环流条件更加有利于气旋的生成和增强。
台风预测与分析意义
保护人民生命财产安全:通过预测台风的路径和强度,可以提前向受影响地区发布警报,让人们有时间采取防护措施,最大程度上减少台风可能带来的人员伤亡和财产损失。
气象科学研究:台风是一个复杂的气象系统,研究台风的形成、发展和消散过程,有助于深入理解大气环流和热力学过程。通过对台风的观测和分析,可以提高对天气和气候系统的认识,改进气象预报模型和算法。
为灾害应对提供支持:通过台风预测和分析,可以为应急管理部门提供科学依据,帮助他们制定灾害应对方案和紧急救援计划。同时,也能够提前预测受影响地区的灾情,为救援力量的调度和资源的调配提供有针对性的指导。
气候变化研究:随着全球气候变化的加剧,台风的频率和强度可能会发生变化。通过对台风预测与分析的长期观测和研究,可以探讨气候变化对台风活动的影响,为应对气候变化提供科学参考和决策支持。
台风历史数据分析
1951-2022年期间在亚洲地区生成的所有台风数据表:typhoon_data.csv
下载地址:链接:https://pan.baidu.com/s/1FjMSnngby4qUNL2fVCg-Jg?pwd=rxfs
提取码:rxfs
台风索引信息表:typhoon_info.csv
下载地址:链接:链接:https://pan.baidu.com/s/1giaOVpDEx9XHzCkXJs_6XQ?pwd=2a3o
提取码:2a3o
数据字段结构
,International number ID,year,month,day,hour,grade,Latitude of the center,Longitude of the center,Central pressure,Maximum sustained wind speed,Direction of the longest radius of 50kt winds or greater,The longeast radius of 50kt winds or greater,The shortest radius of 50kt winds or greater,Direction of the longest radius of 30kt winds or greater,The longeast radius of 30kt winds or greater,The shortest radius of 30kt winds or greater,Indicator of landfall or passage
0,5101,1951,2,19,6,Tropical Depression,200,1385,1010,,,,,,,,
1,5101,1951,2,19,12,Tropical Depression,200,1385,1010,,,,,,,,
2,5101,1951,2,19,18,Tropical Depression,230,1421,1000,,,,,,,,
3,5101,1951,2,20,0,Tropical Cyclone of TS intensity or higher,250,1460,994,,,,,,,,
4,5101,1951,2,20,6,Tropical Cyclone of TS intensity or higher,276,1506,994,,,,,,,,
5,5101,1951,2,20,12,Tropical Cyclone of TS intensity or higher,289,1533,994,,,,,,,,
6,5101,1951,2,20,18,Tropical Cyclone of TS intensity or higher,313,1575,992,,,,,,,,
7,5101,1951,2,21,0,Tropical Cyclone of TS intensity or higher,326,1621,990,,,,,,,,
数据加载分析
import numpy as np
import pandas as pd
import matplotlib.pyplot as plt
import folium
import seaborn as sns

data = pd.read_csv("typhoon_data.csv", index_col=0)
info = pd.read_csv("typhoon_info.csv", index_col=0)

print(data.shape)
data.sample(5)
print(info.shape)
info.sample(5)

print(len(data["International number ID"].unique()))
vc = data["International number ID"].value_counts()

# 数据处理
data[data["year"] < 1977]["grade"].unique()
data[data["year"] >= 1977]["grade"].unique()
data = data[data["year"] >= 1977]


typhoons = data["International number ID"].unique() # Unique IDs of typhoons
info[info["Name"].str.strip() == "MAEMI"]
我们知道今年第5号台风“杜苏芮”在菲律宾以东洋面生成,位置大致在东经132.8°北纬13.9°
现在我们查找在132,1300附近位置上生成的台风生成的情况路径:
similar_data = data[((data["Latitude of the center"] < 140) & (data["Latitude of the center"] > 110)) & \
                   ((data["Longitude of the center"] < 1440) & (data["Longitude of the center"] > 1240))]
similar_data.to_csv("similar_data.csv")
similar_data.csv中生成找到多个在这附近生成的台风:
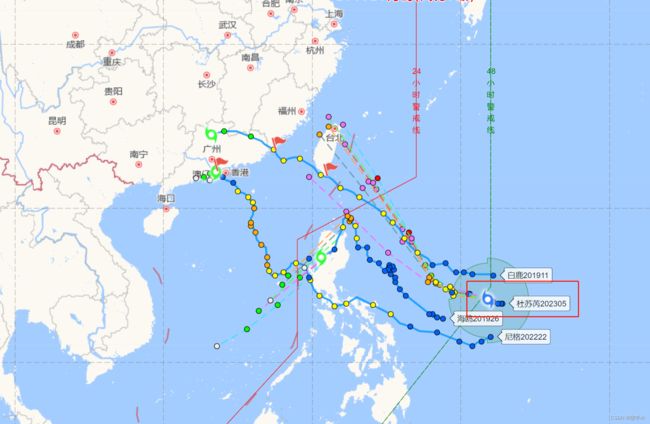
选择其中四个台风分析路径,其中查看1911台风,意思是2019年的11号台风白鹿,生成路径分析图:
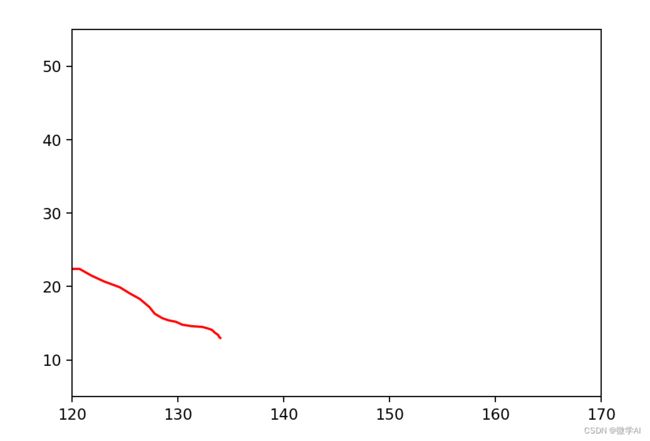
轨迹图:
maemi_data = data.copy()[data["International number ID"]==1911]

maemi_data["Elapsed Hour"] = (maemi_data["day"]-4)*24 + maemi_data["hour"]
maemi_data.head()

maemi_data = maemi_data.drop(["International number ID", "year", "month", "day", "hour"], axis=1)
maemi_data.head()

maemi_data["Longitude of the center"] /= 10
maemi_data["Latitude of the center"] /= 10

fig = plt.figure(figsize=(3,3))
plt.xlim(120, 170)
plt.ylim(5, 55)
plt.plot(maemi_data["Longitude of the center"], maemi_data["Latitude of the center"], "red")
plt.show()
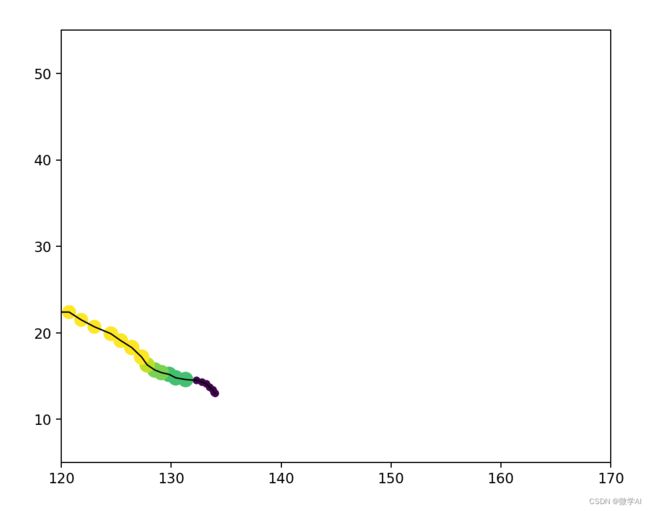
散点图
scale = maemi_data["The longeast radius of 30kt winds or greater"].fillna(60)
fig = plt.figure(figsize=(5,5))
plt.xlim(120, 170)
plt.ylim(5, 55)
plt.plot(maemi_data["Longitude of the center"], maemi_data["Latitude of the center"], "black", linewidth=1)
plt.scatter(maemi_data["Longitude of the center"], maemi_data["Latitude of the center"], s=scale/3, c=maemi_data["Maximum sustained wind speed"])
plt.show()
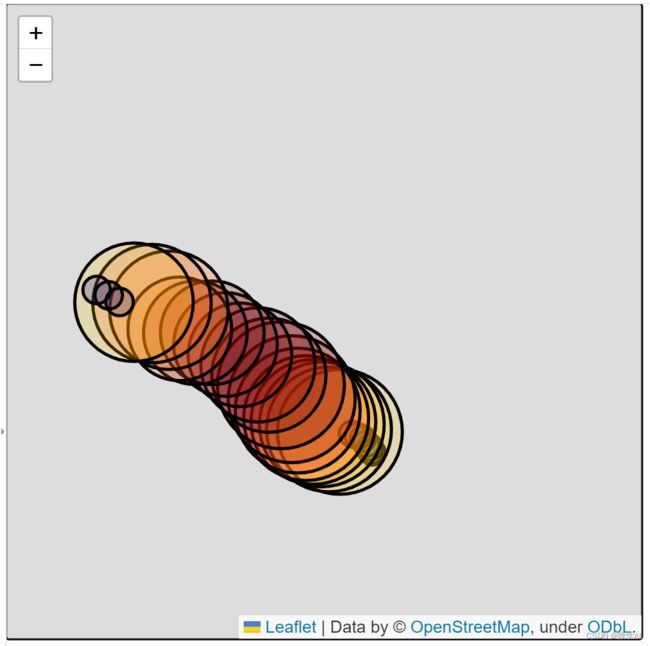
地图风圈
import matplotlib.cm as cm

c = maemi_data.copy()["Maximum sustained wind speed"]
cmap = cm.jet

def rgb_to_hex(rgb):
    return '#%02x%02x%02x' % rgb
m = folium.Map(location=[38.9, 153.2], zoom_start=3, width=600, height=600)
for i in range(len(maemi_data)):
    color = cmap(c.iloc[i]/c.max())
    color = tuple([int(c*255) for c in color[:3]])
    color = rgb_to_hex(color)
    folium.Circle(location=[maemi_data.iloc[i]["Latitude of the center"], maemi_data.iloc[i]["Longitude of the center"]],
                 radius=scale.iloc[i]*1852,  #  nautical mile to meter
                 fill=True,
                 color="black",
                 fill_color=color).add_to(m)
m.save('map.html')  # 保存地图为HTML文件
import webbrowser
webbrowser.open('map.html', new=2)  # 在浏览器中打开地图
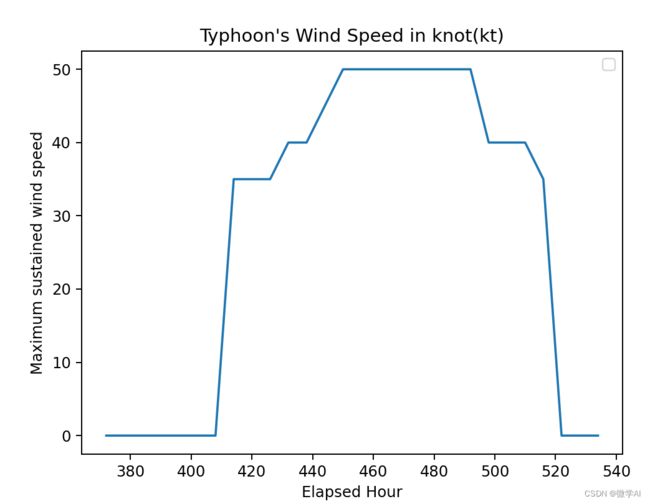
台风中心气压和风力变化情况
plt.title("Typhoon's Central Pressure in hPa")
plt.plot(maemi_data["Elapsed Hour"],maemi_data["Central pressure"])
plt.xlabel("Elapsed Hour")
plt.ylabel("Central Pressure")
plt.legend()
plt.show()


plt.title("Typhoon's Wind Speed in knot(kt)")
plt.plot(maemi_data["Elapsed Hour"],maemi_data["Maximum sustained wind speed"])
plt.xlabel("Elapsed Hour")
plt.ylabel("Maximum sustained wind speed")
plt.legend()
plt.show()


sns.heatmap(maemi_data.corr(), annot=True)
plt.show()
总结
台风预测是基于多源数据和分析手段,通过对台风路径、强度和可能影响的预测,为相关地区提供早期警报和决策支持,以最大程度减少台风可能造成的人员伤亡和财产损失。然而,由于台风的复杂性和不确定性,持续的观测和改进预测技术仍然是提高预测准确性的重要方向。
“杜苏芮”极有可能登陆或擦过台风再次登陆福建,“杜苏芮”将以每小时10-15公里的速度向西偏北转西北方向移动,强度逐渐加强,向台湾东部海面靠近,26日开始影响我国东南沿海。
