用R语言绘制三维曲面
文章目录
- graphics::persp
- lattice::wireframe
- rgl::plot3d
- rgl::surface3d
- scatterplot3d::scatterplot3d
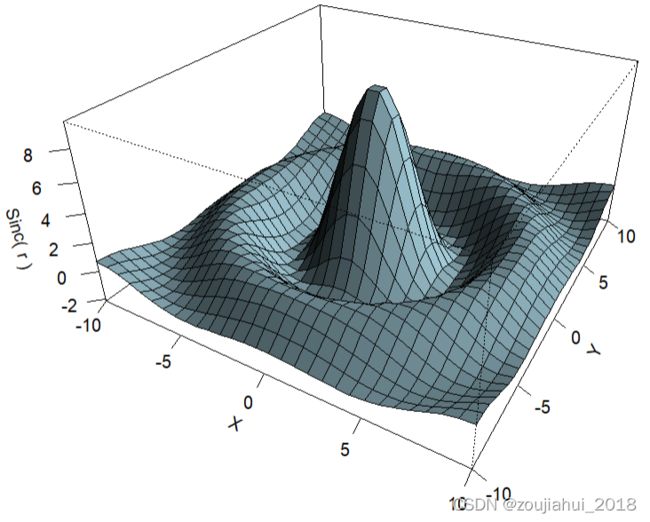
graphics::persp
x <- seq(-10, 10, length.out = 30)
y <- x
f <- function(x, y) { r <- sqrt(x^2+y^2); 10 * sin(r)/r }
z <- outer(x, y, f)
z[is.na(z)] <- 1
op <- par(bg = "white")
persp(x, y, z, theta = 30, phi = 30, expand = 0.5, col = "lightblue")
persp(x, y, z, theta = 30, phi = 30, expand = 0.5, col = "lightblue",
      ltheta = 120, shade = 0.75, ticktype = "detailed",
      xlab = "X", ylab = "Y", zlab = "Sinc( r )"
) -> res
round(res, 3)

lattice::wireframe
library(lattice)
# 构建网格数据
d <- expand.grid(x =10:60, y = 5:40,g=2:3)
# 构建因变量
d$z <-log((d$x^d$g+d$y^2)*d$g)
# 绘制曲面拟合图
wireframe(z~x*y,
          data = d,
          shade=T,  # 曲面颜色渲染
          groups=g, #分组
          drape=T,   # 是否以右侧的色柱区分曲面
          colorkey=T,  # 是否显示色标
          scales=list(arrows=T), #是否显示箭头
          screen=list(z=45,x=-60) #调整图片角度
)

rgl::plot3d
library(rgl)
d <- expand.grid(x =10:60, y = 5:40,g=2:3)
d$z <-log((d$x^d$g+d$y^2)*d$g)
plot3d(d$x,d$y,d$z,
       type="s",
       size = 0.5,
       col=terrain.colors(length(d$z)))

plot3d()所绘制的图形是可以用鼠标调整视角的。
plot3d(lm(mpg ~ wt + I(wt^2) + qsec,
          data = mtcars),
       plane.col =topo.colors(1))

rgl::surface3d
# 设置x,y,z值
z <- 4 * volcano
x <- 8 * (1:nrow(z))
y <- 6 * (1:ncol(z))
# 设置 颜色
zlim <- range(z)
zlen <- zlim[2] - zlim[1] + 1
colorlut <- topo.colors(zlen)
col <- colorlut[ z - zlim[1] + 1 ]
# 绘制曲面图
open3d()
surface3d(x, y, z, color = col, back = "lines")

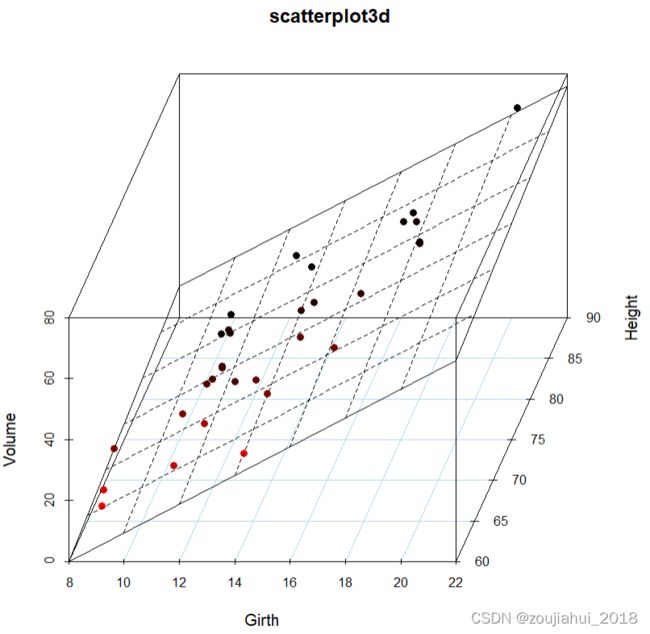
scatterplot3d::scatterplot3d

# 绘制3D 散点图
data(trees)
s3d <- scatterplot3d(trees,
                     type="p",
                     highlight.3d=TRUE,
                     angle=60,
                     #scale.y=0.8,
                     pch=16,
                     zlim = c(0,80),
                     col.grid="lightblue",
                     main="scatterplot3d")

# 散点图中添加拟合曲面
tree_lm <- lm(Volume ~ Girth + Height,data = trees)
s3d$plane3d(tree_lm, lty.box = "solid")