西瓜书第六章习题及答案
6.1

公式 6.2

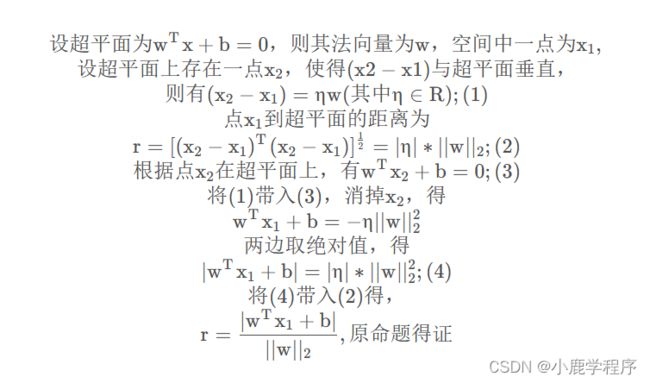
点到面的推到过程(如下图里面的图片),不禁让我想到高中班主任在黑板上的咔咔一顿猛写,高中班主任教的真好,哎,是我zs跟不上啊!
点到平面的距离公式推导
感觉如果记住了公式这个距离公式很容易想到,非要看推导的话就看下面的图片吧!

6.2
前方高能——搬运工上线! 唉!
import pandas as pd
import numpy as np
import matplotlib.pyplot as plt
import seaborn as sns
df = pd.read_csv('F:\\python\\dataset\\chapter6\\watermelon_3a.csv', delimiter=",")
df
df.columns = ['id', 'density', 'sugar_content', 'label']
df.set_index(['id'])
plt.figure(0)
sns.FacetGrid(df, hue='label', size=5).map(plt.scatter, 'density', 'sugar_content').add_legend()
plt.show()
X = df[['density', 'sugar_content']].values
y = df['label'].values
print(X)
print(y)
from sklearn import svm
from sklearn.model_selection import cross_val_score

for fig_num, kernel in enumerate(('linear', 'rbf')):
    # initial
    svc = svm.SVC(C=1000, kernel=kernel)  # classifier 1 based on linear kernel
    print("交叉验证评分",cross_val_score(svc,X,y,cv=5,scoring='accuracy').mean())
    # train
    svc.fit(X, y)
    print("支持向量数目",svc.n_support_.sum())
    print("支持向量",svc.support_vectors_)
    # get support vectors
    sv = svc.support_vectors_

    ##### draw decision zone
    plt.figure(fig_num)
    plt.clf()

    # plot point and mark out support vectors
    plt.scatter( X[:,0],  X[:,1], edgecolors='k', c=y, cmap=plt.cm.Paired,  zorder=10)
    plt.scatter(sv[:,0], sv[:,1], edgecolors='k', facecolors='none', s=80, linewidths=2, zorder=10)

    # plot the decision boundary and decision zone into a color plot
    x_min, x_max = X[:, 0].min() - 0.2, X[:, 0].max() + 0.2
    y_min, y_max = X[:, 1].min() - 0.2, X[:, 1].max() + 0.2
    XX, YY = np.meshgrid(np.arange(x_min, x_max, 0.02), np.arange(y_min, y_max, 0.02))
    Z = svc.decision_function(np.c_[XX.ravel(), YY.ravel()])
    Z = Z.reshape(XX.shape)
    plt.pcolormesh(XX, YY, Z>0, cmap=plt.cm.Paired)
    plt.contour(XX, YY, Z, colors=['k', 'k', 'k'], linestyles=['--', '-', '--'], levels=[-.5, 0, .5])

    plt.title(kernel)
    plt.axis('tight')

plt.show()
线性核函数:
 高斯核函数:


结论:
可以估计出,面向该题数据集,高斯核函数的拟合更好(间隔更小),且用到的支持向量更少。


