echarts柱状图每根柱子添加警戒值/阈值,分段警戒线

需求:柱状图每根柱子都添加单独的警戒值(黄色线部分),效果图如下:
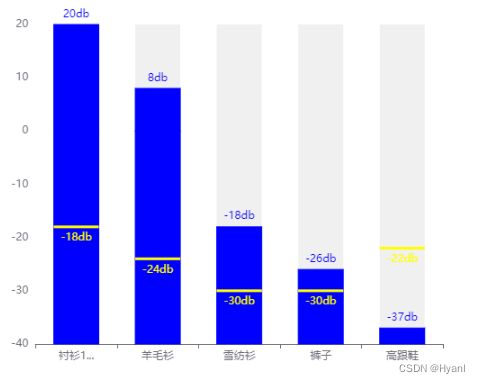
echarts柱状图每根柱子添加警戒值/阈值,分段警戒线_第1张图片
实现方式我这有两种方案,如下介绍。
方案1:使用echarts的标线markLine实现(ps:此种方案有弊端:需要一一设置每个柱子的标线起始点,不好控制,不太建议使用)
代码如下:

<body>
    <!-- 为 ECharts 准备一个定义了宽高的 DOM -->
    <div id="main" style="width: 600px;height:400px;"></div>
    <script type="text/javascript">
        // 基于准备好的dom,初始化echarts实例
        var myChart = echarts.init(document.getElementById('main'));
         // 警戒线
        let markLines = []
        let markLineValue = [10,20,30,40,30] //警戒线值
        let markLineItem = [
                                //第一条警戒线
                                {
                                    yAxis: markLineValue[0],
                                    x: 60, //设置警戒线的起点偏移量
                                    lineStyle: { type: "solid", color: "yellow", width: 3 },
                                    label: { show: true, color: "yellow", position: "insideMiddleBottom", formatter: markLineValue[0] + 'db' },
                                },
                                {
                                    position: "middle",
                                    yAxis: markLineValue[0],
                                    x: 110, //设置警戒线的终点偏移量
                                    lineStyle: { type: "solid", color: "yellow", width: 3 },
                                    label: { show: true, position: "insideMiddleBottom" },
                                }
                            ]
        markLines.push(markLineItem);
        //设置每一条标线的起始偏移量,根据实际情况自行改之
        for (let i = 1; i <markLineValue.length; i++) {
            let item = JSON.parse(JSON.stringify(markLines[i-1]))
            let xStart = item[0].x
            let xEnd = item[1].x
            item[0].x = xStart + 115
            item[0].yAxis = markLineValue[i]
            item[0].label.formatter = markLineValue[i] +'db'
            item[1].x = xEnd + 115
            item[1].yAxis = markLineValue[i]
            markLines.push(item)
        }
        var option = {
            title: {
                text: 'ECharts 入门示例'
            },
            tooltip: {
                show: true,
                trigger: 'axis'
            },
            legend: {
                data: ['销量']
            },
            xAxis: {
                data: ['衬衫11111111111111111', '羊毛衫', '雪纺衫', '裤子', '高跟鞋'],
                axisLabel: {
                    // 文字省略
                    formatter: function (value) {
                        if (value.length > 3) {
                            return `${value.slice(0, 3)}...`
                        }
                        return value
                    }
                }
            },
            yAxis: {
                splitLine: { show: false }
            },
            grid: {
                containLabel: true,
                top: 30,
                left: 10,
                right: 10,
                bottom: 8
            },
            series: [
                {
                    name: '销量',
                    type: 'bar',
                    data: [5, 20, 36, 10, 10],
                    barWidth: '50px', // 柱图宽度
                    itemStyle: {
                        normal: {
                            label: {
                                formatter: '{c}' + 'db',
                                show: true,
                                position: 'top',
                                textStyle: {
                                    color: 'blue'
                                }
                            }
                        }
                    },
                    //设置柱状图背景
                    showBackground: true,
                    backgroundStyle: {
                        color: 'rgba(180, 180, 180, 0.2)'
                    },
                    markLine: {
                        symbol: "none",               //去掉警戒线最后面的箭头
                        data:markLines
                         }
                    }]
        };
        // 使用刚指定的配置项和数据显示图表。
      myChart.setOption(option);
    </script>
</body>

方案2:使用echarts的自定义图形custom实现(此方案较方案一更实用)
代码如下:

<body>
    <!-- 为 ECharts 准备一个定义了宽高的 DOM -->
    <div id="main" style="width: 600px;height:400px;"></div>
    <script type="text/javascript">
        // 基于准备好的dom,初始化echarts实例
        var myChart = echarts.init(document.getElementById('main'));
        let markLineValue = [10,20,30,40,30] //警戒线值
        var option = {
            title: {
                text: 'ECharts 入门示例'
            },
            tooltip: {
                show: true,
                trigger: 'axis'
            },
            legend: {
                data: ['销量']
            },
            xAxis: {
                data: ['衬衫11111111111111111', '羊毛衫', '雪纺衫', '裤子', '高跟鞋'],
                axisLabel: {
                    // 文字省略
                    formatter: function (value) {
                        if (value.length > 3) {
                            return `${value.slice(0, 3)}...`
                        }
                        return value
                    }
                }
            },
            yAxis: {
                splitLine: { show: false }
            },
            grid: {
                containLabel: true,
                top: 30,
                left: 10,
                right: 10,
                bottom: 8
            },
            series: [
                {
                    name: '销量',
                    type: 'bar',
                    data: [5, 20, 36, 10, 10],
                    barWidth: '50px', // 柱图宽度
                    itemStyle: {
                        normal: {
                            label: {
                                formatter: '{c}' + 'db',
                                show: true,
                                position: 'top',
                                textStyle: {
                                    color: 'blue'
                                }
                            }
                        }
                    },
                    //设置柱状图背景
                    showBackground: true,
                    backgroundStyle: {
                        color: 'rgba(180, 180, 180, 0.2)'
                    }
                    },
                    {
                    type: 'custom',
                    // 图形渲染逻辑函数
                    renderItem: function renderItem(param, api) {
                    //获取每根柱子中点的x,y坐标
                        var point = api.coord([api.value(0), api.value(1)]);
                        return {
                            type: 'line',
                            transition: ['shape'],
                            shape: {
                                x1: point[0] - 25, //每根柱子的起点x轴坐标,我这的柱子宽度为50px,起点就为point[0]-50/2
                                x2: point[0] + 25, //每根柱子的终点x轴坐标
                                y1: point[1],
                                y2: point[1]
                            },
                            style: api.style({
                                stroke: api.visual('color'),
                                lineWidth: 3,
                            })
                        };
                    },
                    itemStyle: {
                        borderType: 'soild',   //可以控制警示线的样式
                        normal: {
                            label: {
                                formatter: '{c}' + 'db',
                                show: true,
                                position: 'bottom',
                                textStyle: {
                                    color: 'yellow'
                                }
                            },
                            color: "yellow",
                        }
                    },

                    z: 999, //控制图形前后顺序,数值小会被数值大的覆盖
                    data: markLineValue   //警示线的数值
                }
                    ]
        };
        // 使用刚指定的配置项和数据显示图表。
      myChart.setOption(option);
    </script>
</body>

你可能感兴趣的:(echarts,前端,echarts,前端,javascript)