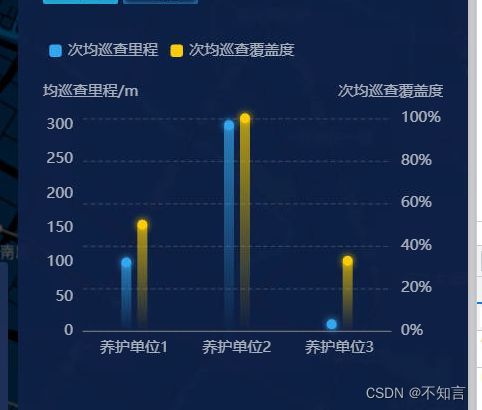
百度echarts 柱状图 顶部拼接圆点效果
话不多说,简言之:原理就是,利用type="bar"的 label 能设置位置的特性,然后设置背景色、宽高、圆角等,再然后color透明即可。代码如下:
核心代码
label: {
    show: true,
    width: 8,
    height: 8,
    borderRadius: 1000,
    color: 'rgba(0,0,0,0)',
    backgroundColor: 'rgba(251, 204, 0, 1)',
    position: ['0%', -4],
    shadowBlur: 6,
    shadowColor: '#FBCC00',
  }
options
const options = {
    tooltip: {
      trigger: 'axis',
      backgroundColor: '#040B15',
      borderColor: '#040B15',
      textStyle: {
        color: 'rgba(255, 255, 255, 0.65)',
        fontSize: 12,
      },
    },
    grid: {
      show: false,
      top: 65, // 一下数值可为百分比也可为具体像素值
      right: '13%',
      bottom: '16%',
      left: '10%',
    },
    legend: {
      data: [
        {
          name: '次均巡查里程',
          itemStyle: {
            color: 'rgba(51, 167, 240, 1)',
          },
        },
        {
          name: '次均巡查覆盖度',
          itemStyle: {
            color: 'rgba(251, 204, 0, 1)',
          },
        },
      ],
      top: '0%',
      left: 0,
      textStyle: {
        color: 'rgba(255, 255, 255, 0.65)',
      },
      itemWidth: 10,
      itemHeight: 10,
    },
    xAxis: [
      {
        type: 'category',
        data: virData.value.map((item) => {
          return {
            value: item.name,
            textStyle: {
              color: 'rgba(255, 255, 255, 0.65)',
            },
          };
        }),
        axisPointer: {
          type: 'shadow',
        },
        axisTick: {
          show: false,
        },
      },
    ],
    yAxis: [
      {
        type: 'value',
        name: '次均巡查里程/m',
        nameTextStyle: {
          color: 'rgba(255, 255, 255, 0.65)',
        },
        min: 0,
        max: Math.max(...virData.value.map((item: any) => item.done)) + 10,
        axisLabel: {
          color: 'rgba(255, 255, 255, 0.65)', // y 轴标注颜色
        },
        splitLine: {
          lineStyle: {
            type: 'dashed', // 虚线
            color: 'rgba(255, 255, 255, 0.15)',
          },
          show: false,
        },
      },
      {
        type: 'value',
        name: '次均巡查覆盖度',
        min: 0,
        max: 100,
        nameTextStyle: {
          color: 'rgba(255, 255, 255, 0.65)',
        },
        axisLabel: {
          formatter: '{value}%',
          color: 'rgba(255, 255, 255, 0.65)', // y 轴标注颜色
        },
        splitLine: {
          lineStyle: {
            type: 'dashed', // 虚线
            color: 'rgba(255, 255, 255, 0.15)',
          },
          show: true,
        },
      },
    ],
    series: [
      {
        name: '次均巡查里程',
        type: 'bar',
        data: virData.value.map((item: any) => item.done),
        itemStyle: {
          color: {
            type: 'linear',
            x: 0, // 右
            y: 0, // 下
            x2: 0, // 左
            y2: 1, // 上
            colorStops: [
              {
                offset: 0,
                color: 'rgba(51, 167, 240, 0.70)', // 0% 处的颜色
              },
              {
                offset: 1,
                color: 'rgba(51, 167, 240, 0)', // 100% 处的颜色
              },
            ],
          },
        },
        barWidth: 8,
        label: {
          show: true,
          width: 8,
          height: 8,
          borderRadius: 1000,
          color: 'rgba(0,0,0,0)',
          backgroundColor: 'rgba(51, 167, 240, 1)',
          position: ['0%', -4],
          shadowBlur: 6,
          shadowColor: '#33A7F0',
        },
      },
      {
        name: '次均巡查覆盖度',
        type: 'bar',
        tooltip: {},
        data: virData.value.map((item: any) => item.total),
        itemStyle: {
          color: {
            type: 'linear',
            x: 0, // 右
            y: 0, // 下
            x2: 0, // 左
            y2: 1, // 上
            colorStops: [
              {
                offset: 0,
                color: 'rgba(251, 204, 0, 0.70)', // 0% 处的颜色
              },
              {
                offset: 1,
                color: 'rgba(251, 204, 0, 0)', // 100% 处的颜色
              },
            ],
          },
        },
        barWidth: 8,
        barGap: '60%',
        yAxisIndex: 1,
        label: {
          show: true,
          width: 8,
          height: 8,
          borderRadius: 1000,
          color: 'rgba(0,0,0,0)',
          backgroundColor: 'rgba(251, 204, 0, 1)',
          position: ['0%', -4],
          shadowBlur: 6,
          shadowColor: '#FBCC00',
        },
      },
    ],
  }
最终效果
废话几句:中途找个其他写法,比如:
1.冗余一个type=“bar”,然后用堆叠属性 stack 设置上面的点位,但是有个问题是,如果顶部效果是个小方块,那没啥问题,也挺完美(只是需要单独去处理下tooltip);如果想要个圆点效果就差点事了,它跟下面的柱子间的位置好像也没法调整(翻文档,实在没找到属性设置),最终的效果会是圆点跟柱子时脱离的,跟UI不符了。
2.冗余一个type=“scatter”,然后也是用堆叠属性 stack 取设置点位。此种方式的问题是,位置、效果都没问题,但是偏移量跟legend的点击之间有问题了。如果没有图例点击事件也能用,但是如果图例是可点击的,那么当隐藏其中一列时,另一列上的小圆点位置没变,柱子位置自适应,两者间就会发生错位(因为一开始为了对上位置,scatter的偏移量是写死的)。此方式如果想用,需要自主处理下legend的点击事件,然后手动再设置下图表属性即可。
