TensorFlow项目练手(三)——基于GRU股票走势预测任务
项目介绍
项目基于GRU算法通过20天的股票序列来预测第21天的数据,有些项目也可以用LSTM算法,两者主要差别如下:
- LSTM算法:目前使用最多的时间序列算法,是一种特殊的RNN(循环神经网络),能够学习长期的依赖关系。主要是为了解决长序列训练过程中的梯度消失和梯度爆炸问题。简单来说,就是相比普通的RNN,LSTM能够在更长的序列中有更好的表现。
- GRU算法:是一种特殊的RNN。和LSTM一样,也是为了解决长期记忆和反向传播中的梯度等问题而提出来的。相比LSTM,使用GRU能够达到相当的效果,并且相比之下更容易进行训练,能够很大程度上提高训练效率,因此很多时候会更倾向于使用GRU。
一、准备数据
1、获取数据
- 通过命令行安装yfinance
- 通过api获取股票数据
- 保存到csv中方便使用
import pandas_datareader.data as web
import datetime
import matplotlib.pyplot as plt
import pandas as pd
import numpy as np
plt.rcParams['font.sans-serif']='SimHei' #图表显示中文

import yfinance as yf
yf.pdr_override() #需要调用这个函数

# 1、获取股票数据
#上海的股票代码+.SS;深圳的股票代码+.SZ :
stock = web.get_data_yahoo("601318.SS", start="2022-01-01", end="2023-07-17")
# 保存到csv中
pd.DataFrame(data=stock).to_csv('./stock.csv')

# 2、获取csv中的数据
features = pd.read_csv('stock.csv')
features = features.drop('Adj Close',axis=1)
features.head()
2、数据可视化
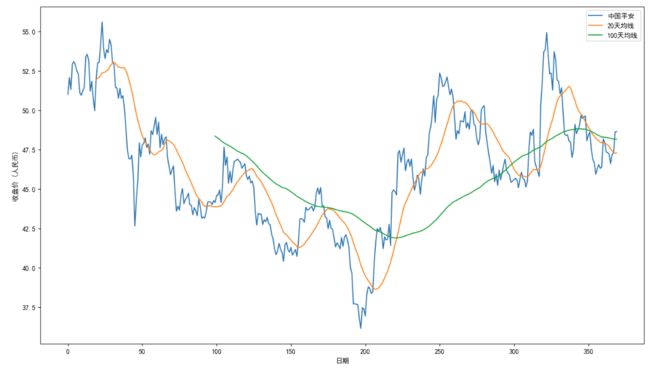
通过绘图的方式查看当前的数据情况
# 3、绘图看看收盘价数据情况
close=features["Close"]
# 计算20天和100天移动平均线:
short_rolling_close = close.rolling(window=20).mean()
long_rolling_close = close.rolling(window=100).mean()
# 绘制
fig, ax = plt.subplots(figsize=(16,9))   #画面大小,可以修改
ax.plot(close.index, close, label='中国平安')   #以收盘价为索引值绘图
ax.plot(short_rolling_close.index, short_rolling_close, label='20天均线')
ax.plot(long_rolling_close.index, long_rolling_close, label='100天均线')
#x轴、y轴及图例:
ax.set_xlabel('日期')
ax.set_ylabel('收盘价 (人民币)')
ax.legend()      #图例
plt.show()      #绘图
3、数据预处理
取出当前的收盘价,删除无用的日期元素
# 4、取出label值
labels = features['Close']
time = features['Date']
features = features.drop('Date',axis=1)
features.head()
进行数据的归一化
# 5、数据预处理
from sklearn import preprocessing
input_features = preprocessing.StandardScaler().fit_transform(features)
input_features
4、构建数据序列
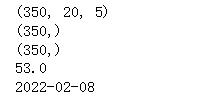
由于RNN的算法要求我们要有一定的序列,来预测出下一个值,所以我们按照20天的数据作为一个序列
# 6、定义序列,[下标1-20天预测第21天的收盘价]
from collections import deque

x = []
y = []

seq_len = 20
deq = deque(maxlen=seq_len)
for i in input_features:
    deq.append(list(i))
    if len(deq) == seq_len:
        x.append(list(deq))

x = x[:-1] # 取少一个序列,因为最后个序列没有答案
y = features['Close'].values[seq_len: ] #从第二十一天开始(下标为20)
time = time.values[seq_len: ] #从第二十一天开始(下标为20)

x, y, time = np.array(x), np.array(y), np.array(time)
print(x.shape)
print(y.shape)
print(time.shape)
二、构建模型
1、搭建GRU模型
import tensorflow as tf
from tensorflow.keras import initializers
from tensorflow.keras import regularizers
from tensorflow.keras import layers

from keras.models import load_model
from keras.models import Sequential
from keras.layers import Dropout
from keras.layers.core import Dense
from keras.optimizers import Adam

# 7、搭建模型
model = tf.keras.Sequential()
model.add(layers.GRU(8,input_shape=(20,5), activation='relu', return_sequences=True,kernel_regularizer=tf.keras.regularizers.l2(0.01)))
model.add(layers.GRU(16, activation='relu', return_sequences=True,kernel_regularizer=tf.keras.regularizers.l2(0.01)))
model.add(layers.GRU(32, activation='relu', return_sequences=False,kernel_regularizer=tf.keras.regularizers.l2(0.01)))
model.add(layers.Dense(16,kernel_initializer='random_normal',kernel_regularizer=tf.keras.regularizers.l2(0.01)))
model.add(layers.Dense(1))
model.summary()
2、优化器和损失函数
# 优化器和损失函数
model.compile(optimizer=tf.keras.optimizers.Adam(0.001),
              loss=tf.keras.losses.MeanAbsoluteError(), # 标签和预测之间绝对差异的平均
              metrics = tf.keras.losses.MeanSquaredLogarithmicError()) # 计算标签和预测
3、开始训练
25%的比例作为验证集,75%的比例作为训练集
# 开始训练
model.fit(x,y,validation_split=0.25,epochs=200,batch_size=128)
4、模型预测
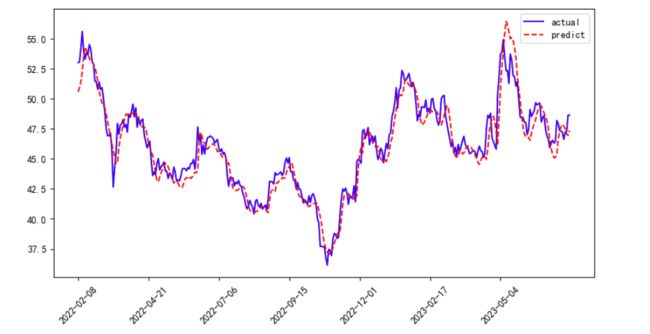
# 预测
y_pred = model.predict(x)
fig = plt.figure(figsize=(10,5))
axes = fig.add_subplot(111)
axes.plot(time,y,'b-',label='actual')
# 预测值,红色散点
axes.plot(time,y_pred,'r--',label='predict')
axes.set_xticks(time[::50])
axes.set_xticklabels(time[::50],rotation=45)

plt.legend()
plt.show()
5、回归指标评估
from sklearn.metrics import mean_squared_error,mean_absolute_error,r2_score
from math import sqrt

#回归评价指标
# calculate MSE 均方误差
mse=mean_squared_error(y,y_pred)
# calculate RMSE 均方根误差
rmse = sqrt(mean_squared_error(y, y_pred))
#calculate MAE 平均绝对误差
mae=mean_absolute_error(y,y_pred)
print('均方误差: %.6f' % mse)
print('均方根误差: %.6f' % rmse)
print('平均绝对误差: %.6f' % mae)
源代码
- 源码查看


